
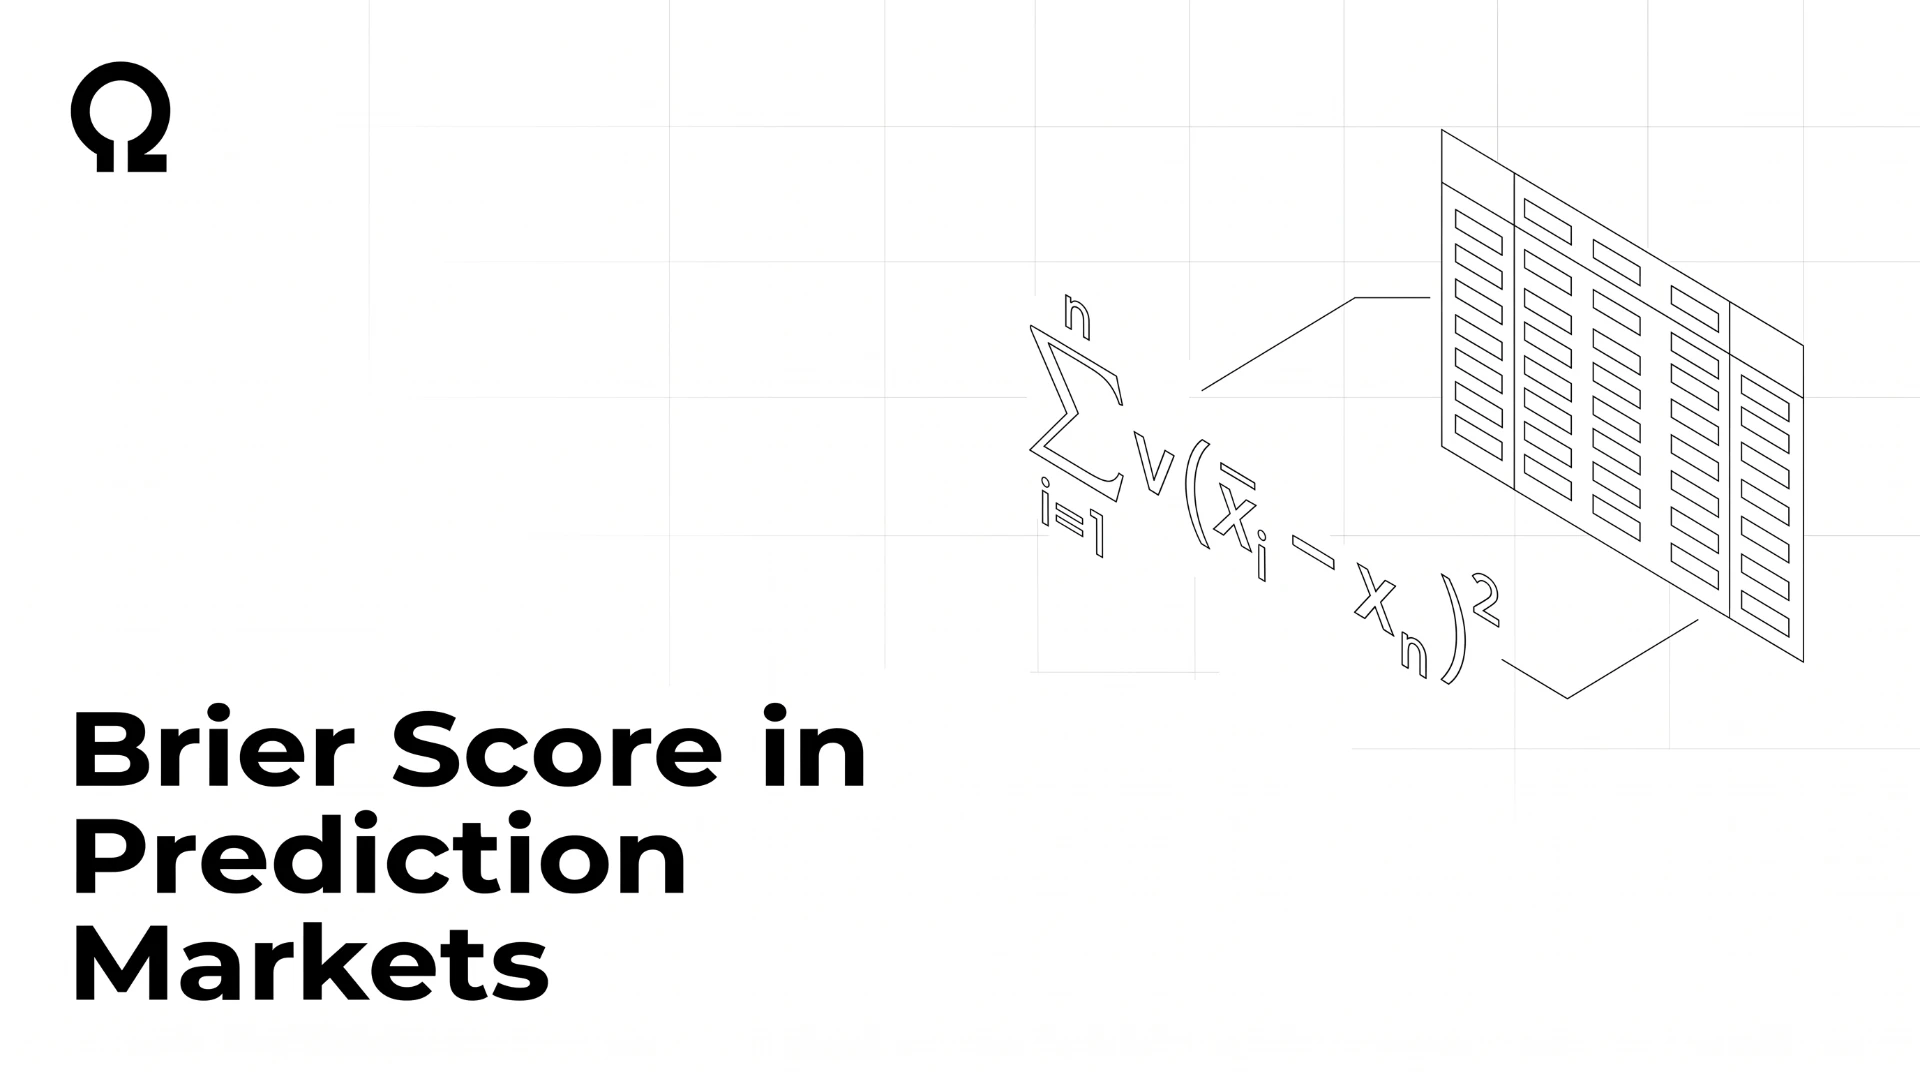
A market price of 73% is not automatically a real probability. It is a number the market produced. Whether that number actually behaves like a probability—whether things priced at 73% happen about 73% of the time—is a separate question, and the Brier score is the standard way to check it.
What it actually measures
The Brier score averages the squared difference between every predicted probability and its actual outcome. Here, f is the predicted probability and o is the outcome: 1 if it happened and 0 if it did not.
In modern usage the score runs from 0 to 1: 0 is a perfect forecast and 1 is the worst possible one. The original 1950 version, built for multi-category weather forecasts, used a 0-to-2 range. The 0-to-1 version is used for binary yes/no markets, which describes most prediction-market contracts.
The number that matters most when reading a Brier score is the baseline. An uninformative 50/50 guess on a binary event with roughly equal base rates scores exactly 0.25. That is not a bad score; it is a no-information score. Anything meaningfully below 0.25 means the forecast is adding information. Anything near it means it is not.
What this looks like in real prediction-market research
Two papers covered in our research roundup get at this directly. One finding is that political markets show persistent underconfidence, and calibration is domain-specific—not a single number that applies across every category a platform runs. A separate paper found that roughly 3% of traders drive most of the actual price discovery. The rest of the volume does not add much informational value; it mostly funds that minority’s edge.
Put those together and a single site-wide Brier score for Polymarket or Kalshi would hide the more useful finding: calibration quality is not simply a property of the platform. It is a property of the category. A well-calibrated politics market and a poorly calibrated niche category can sit on the same exchange at the same time.
Why domain matters, concretely
If a strategy or research project treats “Kalshi’s prices are well-calibrated” as a blanket fact, it skips the part that actually matters: calibrated for which category, and over which period? A category with thin trading, few informed participants, or a genuinely hard-to-forecast underlying event will not calibrate the same way as a deep, liquid, well-covered category. Computing a Brier score per category, rather than per platform, is what separates the two.
Computing it yourself
A Brier score needs two things lined up: the market’s predicted probability at each point in time and the actual resolved outcome. That means price or candle history plus resolution data over a large enough sample of resolved markets in the category being checked—not just a handful. See the API docs for current historical coverage across Kalshi, Polymarket, Predict.fun, and Limitless if you want to run this on a specific category yourself.
FAQ
What’s a “good” Brier score for a prediction market?
Meaningfully below 0.25, which is the uninformed 50/50 baseline for a binary event with roughly equal base rates. There is no single universal “good” threshold beyond that; it depends on how hard the underlying category is to forecast.
Is a lower Brier score always better?
Yes. By construction, lower means the predicted probabilities tracked the actual outcomes more closely. A score of 0 is a perfect forecast.
Does a well-calibrated platform mean every category on it is well-calibrated?
No. Calibration research shows it is domain-specific. A platform can be well-calibrated in one category and not in another at the same time.
What data do I need to compute a Brier score myself?
Time-stamped predicted-probability history, such as candles or price snapshots, plus the confirmed resolved outcome across enough resolved markets in one category to be meaningful.
Why does the Brier score range differ between 0–1 and 0–2 in different sources?
The original 1950 formulation used a 0-to-2 scale for multi-category weather forecasts. The 0-to-1 version, more common for binary yes/no forecasts, is effectively the same calculation scaled differently.