

A market price isn't automatically a probability. We wrote about what a Brier score actually measures a few weeks ago — the short version: it's the average squared distance between a forecast probability and the actual outcome, and the number that gives it meaning is 0.25, the score an uninformed 50/50 guess gets on a binary event. Anything meaningfully below that means a forecast is adding real information.
That piece was conceptual. This one is the actual computation: we pulled our own downloaded Polymarket candle data across all 12 categories the platform runs, and computed real Brier scores, not at one point in time, but at five separate checkpoints through each market's own observed life. Full code, full outputs, and the three charts below are in the public notebook if you want to check the work or run it yourself on more data.
Methodology
Data. Polymarket's candle files log timestamp, Yes, No for every market, but only one side updates per row — most rows have Yes filled and No blank, or the reverse. We forward-filled the last known Yes value across every timestamp to get a continuous probability series per market, rather than a sparse one.
Determining the outcome. We used the last forward-filled value in each file as a proxy for how the market resolved. If it landed at 0.02 or below, we called the outcome 0; at 0.98 or above, 1. Anything in between was dropped as not clearly resolved — a real filter, not a rounding trick. It matters: it's the reason our crypto sample kept only 109 of 300 sampled files (a lot of the local crypto sample is still-open or ambiguous), while people kept 297 of 300.
Five checkpoints, not one. For each resolved market, we found its own observed time range — first recorded timestamp to last — and computed its forecast probability at 10%, 25%, 50%, 75%, and 90% of the way through that range. A single mid-life snapshot can tell you how calibrated a category is. It can't tell you when that calibration shows up — whether prices start rough and sharpen near resolution, or stay noisy the whole way through. That distinction turned out to be the most interesting part of the result.
Sampling. Up to 300 randomly sampled files per category (fixed seed, reproducible), or every file if a category had fewer than 300.
The full results
| Category | 10% | 25% | 50% | 75% | 90% | Resolved markets used |
|---|---|---|---|---|---|---|
| tech | 0.074 | 0.066 | 0.056 | 0.028 | 0.021 | 285 |
| entertainment | 0.085 | 0.069 | 0.054 | 0.039 | 0.030 | 293 |
| people | 0.074 | 0.069 | 0.063 | 0.046 | 0.041 | 297 |
| other | 0.126 | 0.118 | 0.094 | 0.074 | 0.052 | 287 |
| science | 0.113 | 0.090 | 0.092 | 0.050 | 0.029 | 264 |
| weather | 0.128 | 0.123 | 0.101 | 0.074 | 0.024 | 294 |
| crypto | 0.156 | 0.115 | 0.102 | 0.051 | 0.029 | 109 |
| economics | 0.148 | 0.127 | 0.109 | 0.101 | 0.087 | 237 |
| politics | 0.124 | 0.120 | 0.114 | 0.090 | 0.063 | 274 |
| news | 0.192 | 0.160 | 0.127 | 0.108 | 0.062 | 76 |
| sports | 0.184 | 0.168 | 0.164 | 0.171 | 0.156 | 112 |
| esports | 0.207 | 0.197 | 0.188 | 0.149 | 0.099 | 29 |
Every single category beats the 0.25 uninformed baseline at every checkpoint. Prediction markets are adding real information across the board. The interesting part is how unevenly.
Finding 1: calibration is domain-specific, not platform-specific
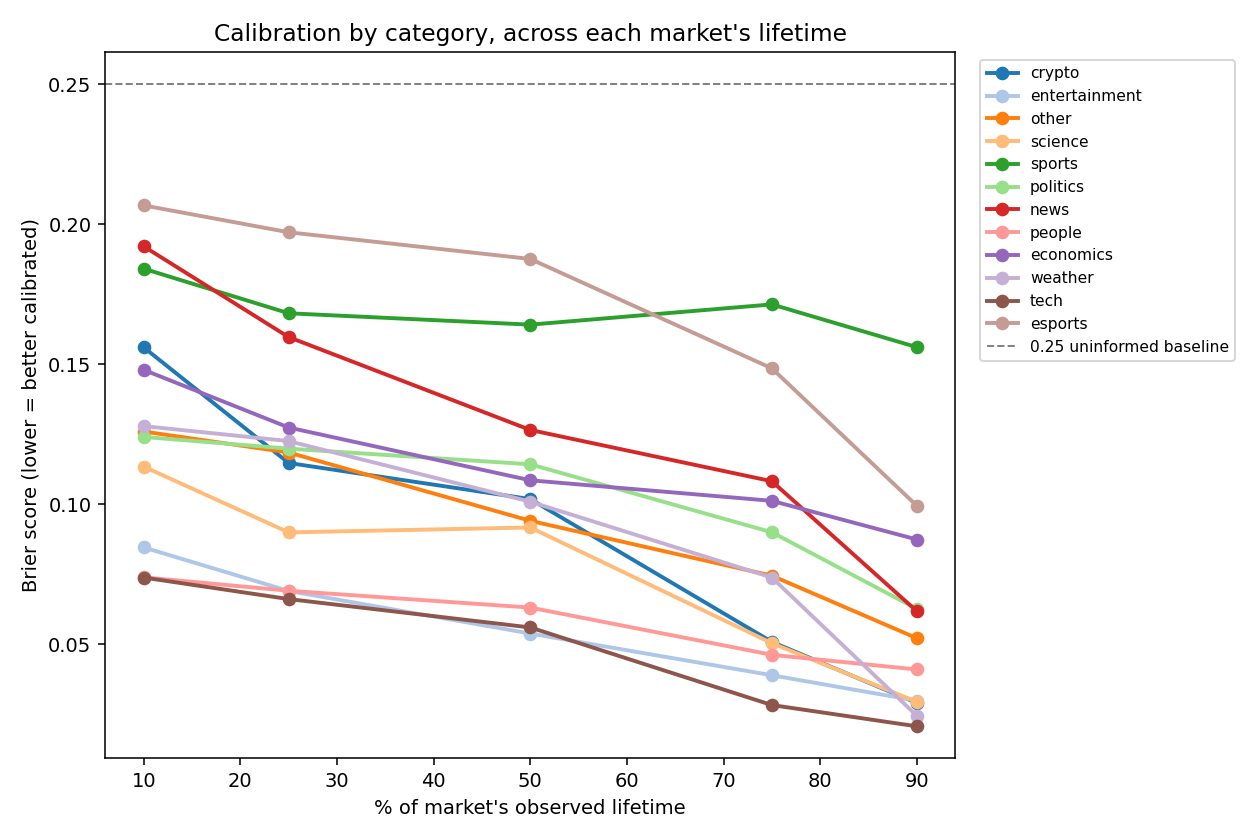
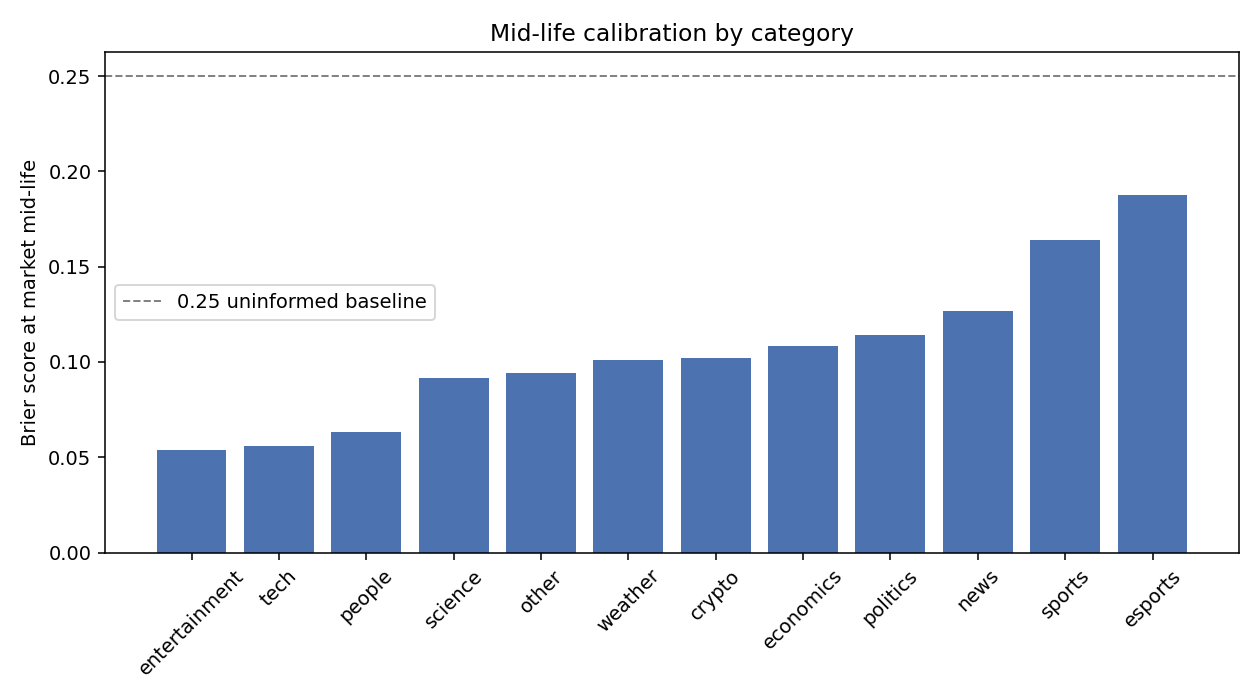
At the midpoint of a market's life, entertainment, tech, and people cluster around 0.05-0.06. Sports and esports sit at 0.16-0.19 — roughly 3x worse. That's not a small gap, and it holds at every one of the five checkpoints we checked, not just the midpoint. This is the same pattern academic research already covered found — one paper in that roundup specifically noted that "calibration is domain-specific," not a platform-wide constant. This is that finding, computed directly from our own data rather than cited from someone else's.
Finding 2: categories don't just differ in calibration level — they differ in whether they sharpen at all
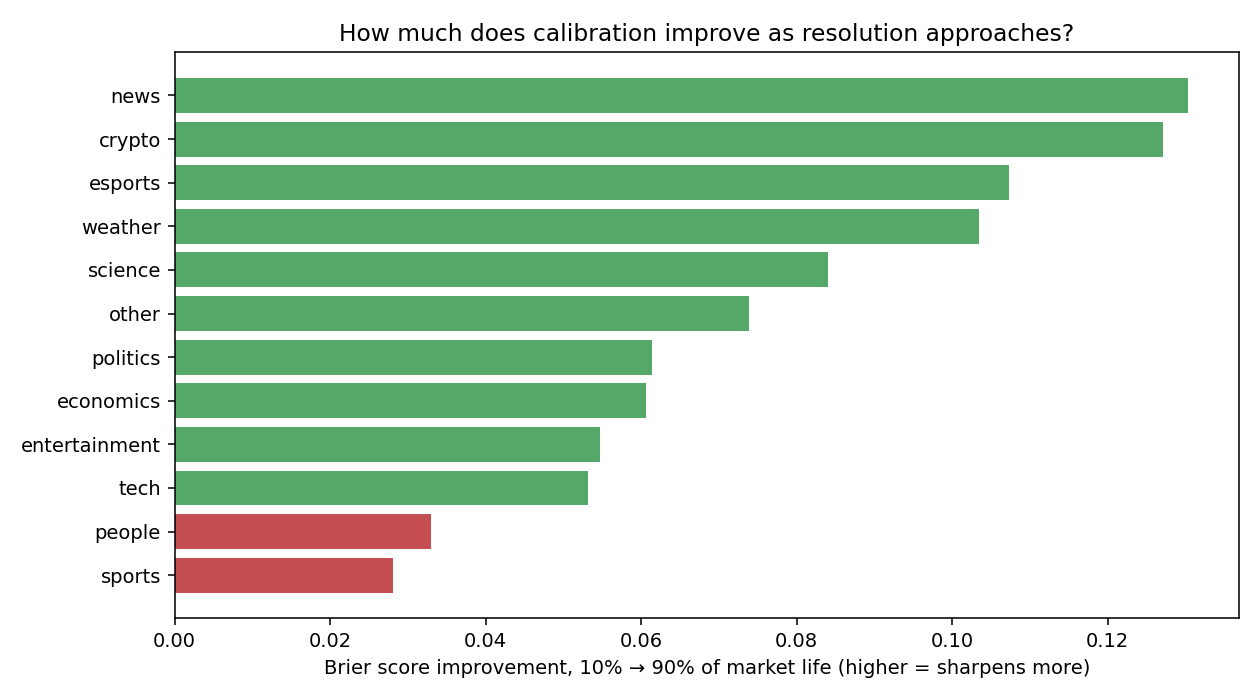
This is the result a single-checkpoint study couldn't have shown. Crypto starts at 0.156, worse than several other categories, and ends at 0.029 — over 5x better by the time a market is 90% through its observed life. News shows the same pattern (0.192 → 0.062). Sports starts at 0.184 and ends at 0.156. It barely moves.
That's a genuinely different market behavior, not just "sports is noisier everywhere." Crypto and news are categories where the underlying uncertainty resolves progressively — more information arrives as a deadline approaches, and the price uses it. Sports outcomes can swing on events (an injury, a momentum shift) that happen literally up to the final whistle, so the market's own uncertainty doesn't shrink the way it does elsewhere, right up until the actual result lands.
What this means practically
If you're using a Polymarket price as a probability estimate for anything — a model input, a hedge, a research claim — how much to trust it depends on category, and that trust should change differently over a market's life depending on which category it is.
- Tech, entertainment, and people markets are trustworthy early. A price from these categories doesn't need much discounting even well before resolution.
- Sports and esports prices don't improve much as the event approaches. Don't assume "closer to game time means a sharper price" here the way it's reasonable to assume in most other categories — this data says that assumption specifically doesn't hold for sports.
- Crypto and news are the opposite pattern. An early-life price in these categories is meaningfully less informative than a late-life one. Weight recent price more heavily than an early snapshot.
The one-line version: "prediction market prices are calibrated" is a fact about a category at a specific point in its life, not a fact about a platform.
Methodology limits
- Sample, not census. Up to 300 randomly sampled files per category, one fixed seed.
esports(29 resolved markets used) andnews(76 total files in our local dataset) are thin samples — treat those two rows as lower-confidence than the rest. - Resolved-outcome inference, not the on-chain resolution record. Our 0.02/0.98 cutoff is a reasonable proxy, not ground truth. Borderline markets get dropped, not misclassified — the intended tradeoff, but it means the resolved-market pool isn't a uniform random sample of every market in a category.
- Checkpoint timing is relative, not absolute. "50% of lifetime" means 50% of the way between a market's first and last recorded timestamp in our data, not 50% of its official scheduled duration. Markets of very different real durations are treated as directly comparable at "50%."
- Polymarket only. Our local Kalshi data currently only covers the crypto category, so this is a single-venue study. A cross-venue version of the same question is a natural next step.
- Single random seed. The ranking is consistent with an earlier single-checkpoint pass using the same seed, which is some evidence it isn't pure sampling noise, but it hasn't been checked across multiple seeds.
Check the work yourself
Every number and chart above comes from this public Jupyter notebook — full code, step-by-step methodology, and the exact reproducible outputs, not just the summary. Historical trade and price data across Kalshi, Polymarket, Predict.fun, Limitless, Deribit, and Binance options, in one schema, is available through the API docs if you want to run a version of this on different categories, more history, or another venue.
FAQ
Is this the same as the earlier Brier score article?
No. That piece explains what a Brier score is and why it matters. This one is the actual computed research using it — real numbers, real charts, a linked notebook.
Why does sports stay poorly calibrated even close to resolution?
Sports outcomes can swing on events that happen up to the literal end of the event — an injury, a late momentum shift — unlike categories where the underlying uncertainty resolves progressively well before the deadline. The market's own uncertainty doesn't shrink the way it does elsewhere.
Which categories should I trust most as probability estimates?
Entertainment, tech, and people are the best-calibrated at every checkpoint tested. Sports and esports are the worst, and esports's sample is thin enough (29 resolved markets) to treat cautiously either way.
Does a market price get more reliable the closer it gets to resolution?
Usually yes — crypto and news show dramatic improvement. Sports is the clear exception in this data: it barely improves at all across its observed life.
Can I reproduce this with more data or different categories?
Yes — the notebook is public and the methodology section above documents every step. It needs Kalshi or Polymarket candle data in the same schema Convex Lake's API docs describe.