
Kalshi runs BTC markets as an hourly strike ladder: many simultaneous contracts, each betting on whether BTC will be above or below a specific price at a specific hour. We read every one of the 932,485 locally downloaded BTC market files — a full census, not a sample — to answer three questions: how much of the ladder trades, does volume predict spread, and when does trading happen. The third question has a clean answer. The first two came with a trap: one of our own metrics measured the opposite of what we intended. Full code and output: the notebook on GitHub.
Method
Every file in Kalshi's local BTC candles (candles/kalshi/crypto/btc/, 932,485 files, 2024-12-19 through 2026-06-17). No sampling, no seed. For each file: total volume, average quoted spread (yes_ask - yes_bid) across rows with a valid quote, and the hour of the market's first timestamp. Reading and processing all 932,485 files took under 10 minutes. At that cost, sampling wasn't necessary.
Finding 1: 12% of listed markets ever trade
Of 827,654 files with usable quote data, 100,760 saw a trade: 12.2%. The other 88% of the strike ladder is quoted but untouched. An earlier 4,000-file sample put this at 11.9% — close enough that the sample wasn't misleading, and the number is now exact rather than estimated.
Finding 2: more volume means a tighter spread
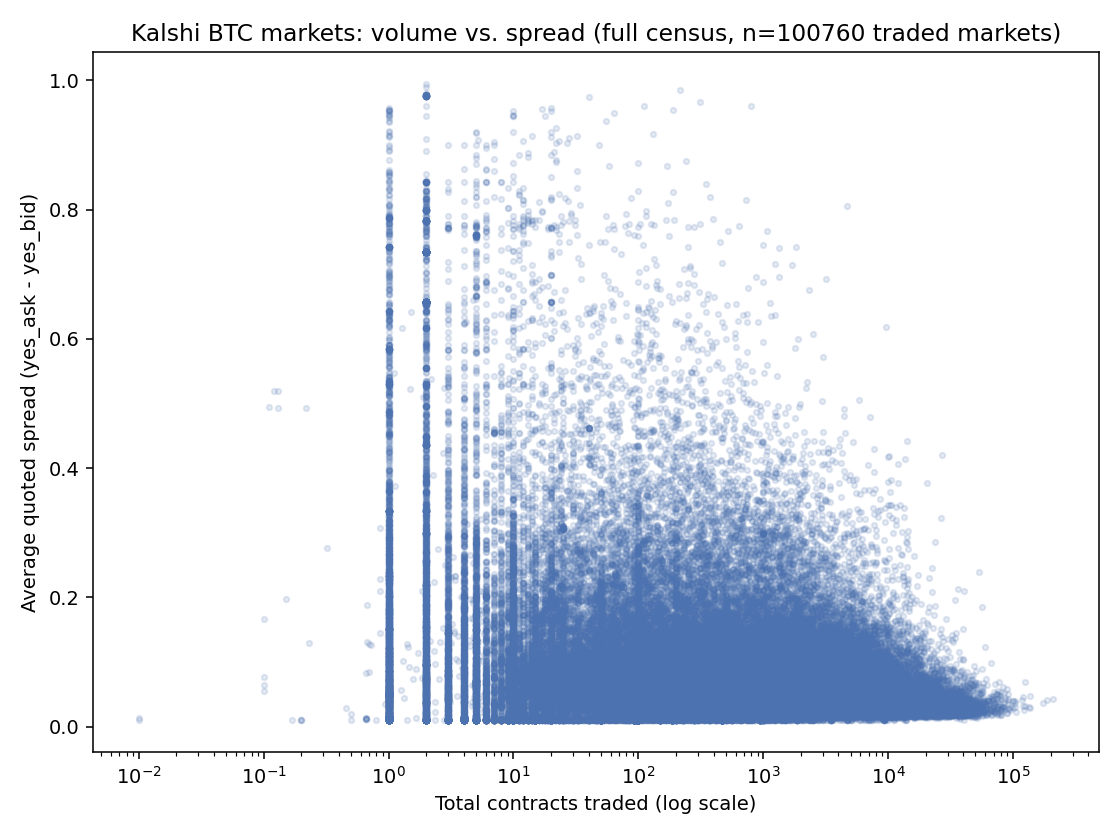
Correlation between log-volume and spread across all 100,760 traded markets: -0.318. The scatter shows a funnel: wide spreads only occur at low volume; high-volume markets sit at tight spreads consistently. This fits standard liquidity economics — more flow gives market makers more chances to earn the spread and more information to price confidently, which competes the spread down. It's also consistent with the reverse: a tight spread is easier to trade against, so it draws volume. The data doesn't separate cause from effect, only confirm they move together. The sampled version found -0.370; the full census brings it to -0.318, within the range normal sampling variation produces.
Finding 3: the moneyness proxy backfired
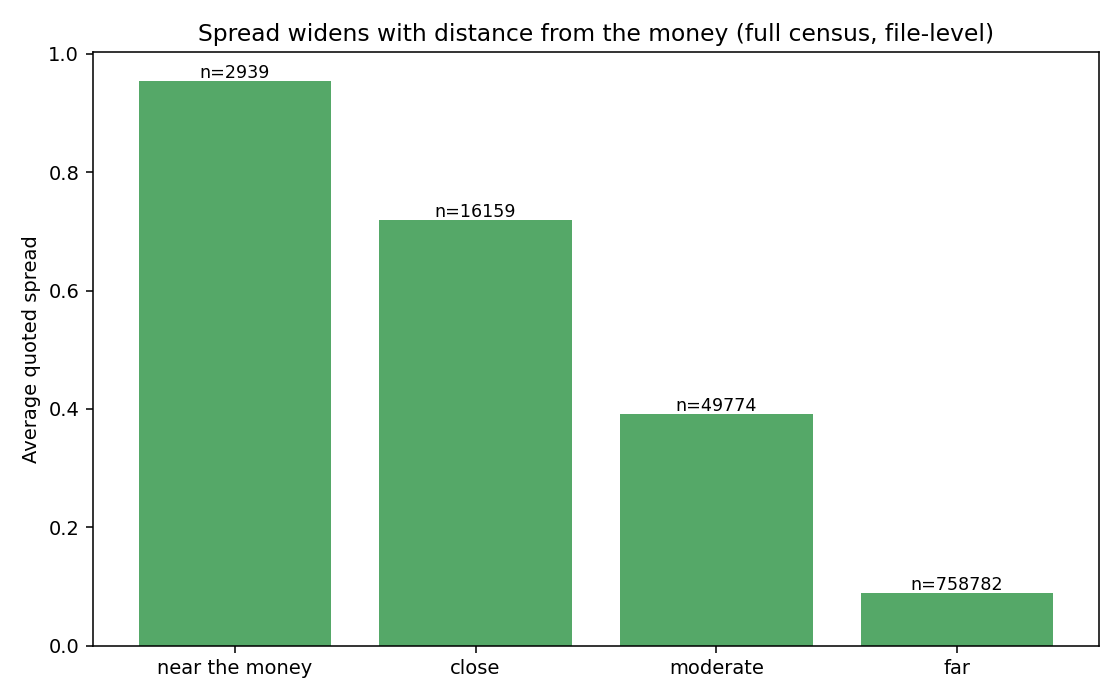
Do near-the-money contracts (quoted close to 0.50) trade tighter than far-from-money ones, the way options markets usually work? We built a moneyness proxy — each file's average quoted midpoint, measured against 0.5 — and bucketed spread by it. The result ran backwards: "near the money" showed the widest spread (0.95, from 2,939 files); "far" showed the tightest (0.09, from 758,782 files).
The cause: a contract that never gets a real quote defaults to yes_bid=0, yes_ask=1 — spread 1.0, midpoint 0.5. That midpoint has nothing to do with genuine 50/50 pricing. The "near the money" bucket was built mostly from dead, never-quoted markets, not liquid ones. We're keeping the chart rather than deleting it: it's a specific, reproducible way to get a moneyness analysis backwards if you don't check what's producing the number.
The corrected version: row-level, dead quotes excluded
Averaging each file's midpoint blends real and dead rows together. Instead, we pooled every individual row across all 827,654 usable files — 22,904,701 rows — and dropped any row with spread ≥ 0.9 (the dead bid=0/ask=1 signature) before bucketing by distance from 0.5.
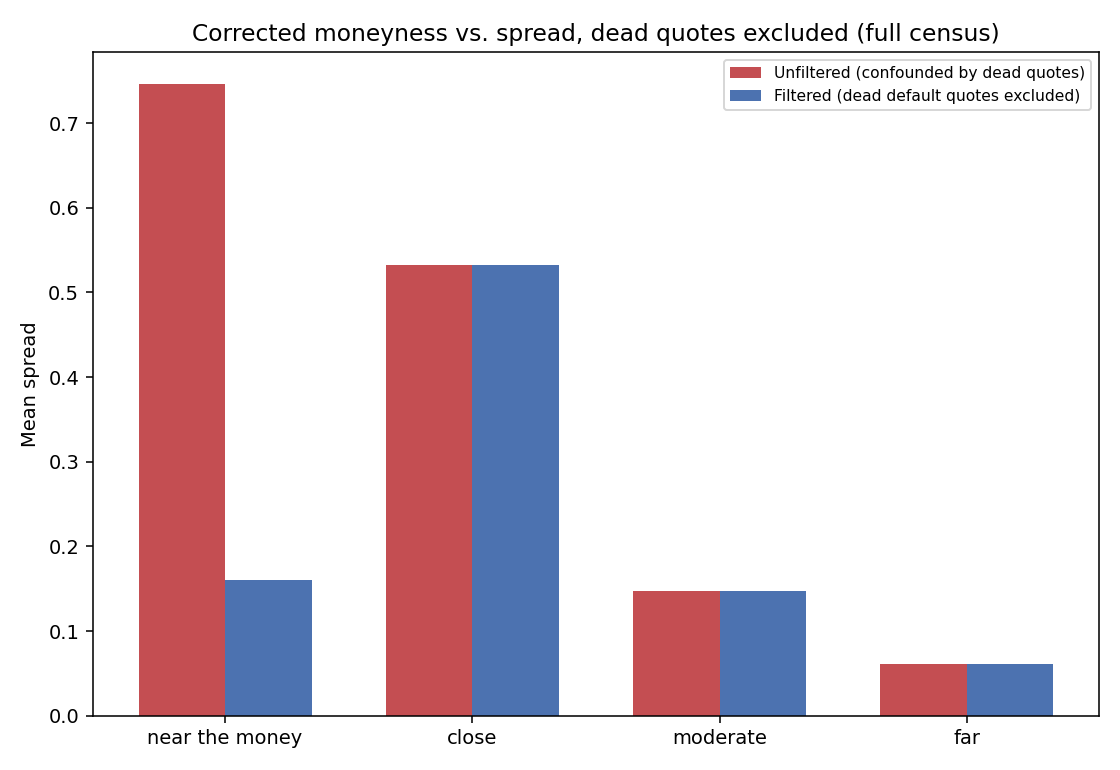
The fix works on the worst bucket: excluding dead quotes drops "near the money" from 0.75 to 0.16. Of 396,891 rows in that bucket, only 105,888 survive the filter — 73% of "near the money" rows in the entire dataset are dead default quotes, not real ones.
The "close" bucket, one step further from 0.5, barely changes: 665,482 raw rows versus 665,439 surviving the filter. Almost none of them are dead quotes by this test. Yet the mean spread there (0.53) is still far above the "moderate" bucket one step out (0.15). That's a different artifact, and with 665,000+ rows behind it, it isn't a small-sample fluke — it's a stable pattern in the "close" bucket this analysis doesn't explain.
The moneyness-vs-spread relationship here still isn't the clean "near the money trades tighter" story a liquid options chain would produce, even after removing the obvious confound. Something specific to the 0.05-0.15 moneyness band needs identifying before any directional claim from this data is safe to trust.
Practical implications
- The sampled version held up. Every headline number from the original 4,000-file sample — 12% traded, -0.37 correlation, the moneyness confound — lands within a few points of the full-census value. A well-chosen sample of a few thousand files is a reasonable stand-in here when a full census isn't practical.
- The second moneyness artifact is now a real question, not a footnote. 665,000+ rows rule out noise. Finding the specific quoting pattern behind the "close" bucket's wide spread is the next step for anyone building liquidity-aware tooling on this data.
- One confound rarely travels alone. Fixing the dead-quote problem exposed a second, distinct one. Check each bucket's own distribution before trusting a single filter on sparse quote data.
- A full census of this corpus costs under 10 minutes. For future Kalshi BTC work, that's cheap enough to default to the full dataset instead of sampling.
Finding 4: trading concentrates in a specific window
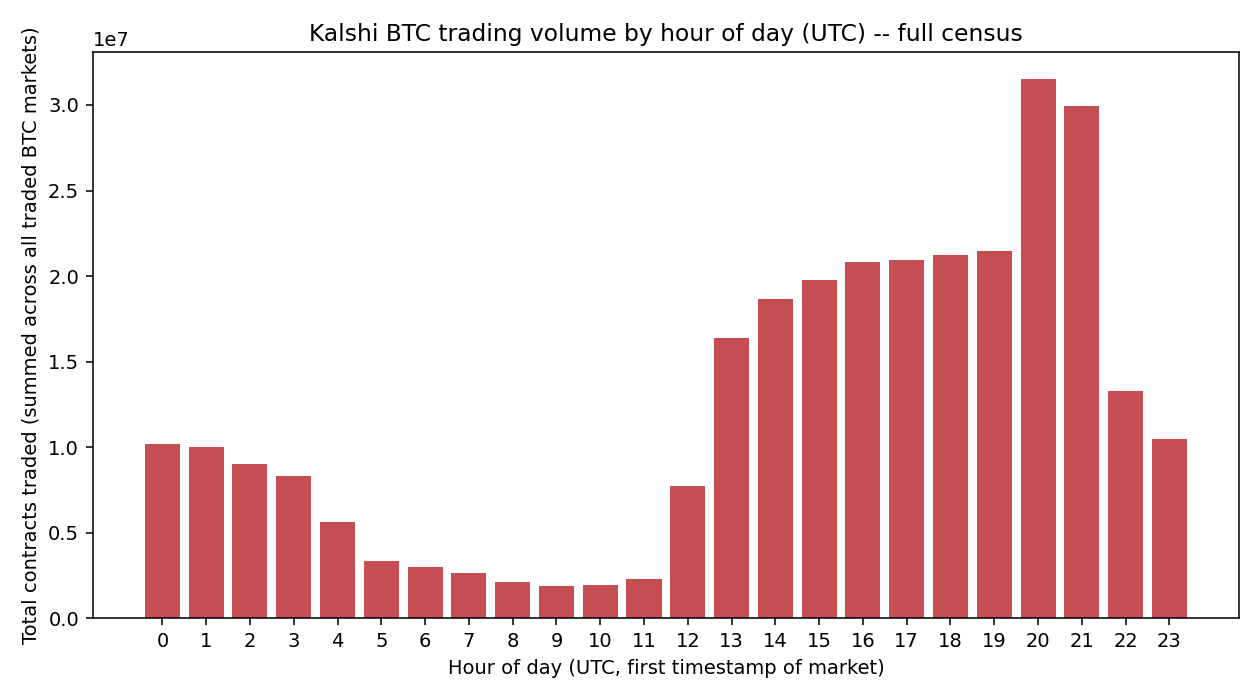
Volume peaks at 20:00-21:00 UTC and nearly disappears from 06:00-10:00 UTC. That window is early-to-mid afternoon in US time zones, consistent with Kalshi's US-based, regulated user base — not the 24-hour pattern spot crypto trading usually shows. The exact ranking shifted slightly from the sampled version (19:00-21:00 UTC looked roughly even there; the census puts 20:00 and 21:00 clearly ahead) — a reminder that even a large sample can misorder close hours while getting the overall shape right.
What this means
If you're building a strategy, a liquidity model, or a monitoring tool on Kalshi's BTC markets: expect the tradeable market to be a small fraction of what's listed, concentrated in a few hours of the day. Don't trust a spread statistic without checking the sample behind it — our own moneyness proxy is a direct example of what happens when you skip that check.
What we couldn't do here
The original goal was a cross-venue check: reconstruct Kalshi's implied BTC price from its strike ladder and compare it to Predict.fun's BTC prices for the same hours. Blocked by a data gap, not a methodology problem — Kalshi's local BTC data ends 2026-06-17, Predict.fun's starts 2026-07-28, zero overlap. A single-hour implied-distribution reconstruction using Kalshi's own data found a related result: the reconstructed distribution is noisier than a liquid options chain's would be, for the same reason as Finding 1 here.
Methodology limits
- Full census. Every one of the 932,485 locally downloaded BTC files, no sampling.
- The moneyness proxy is confounded, and only partly fixable. Excluding dead default quotes fixes the worst bucket; a second, unidentified artifact remains in the "close" bucket, confirmed across 665,000+ rows.
- Volume/spread correlation doesn't establish direction.
- Hour-of-day uses each market's first timestamp, not a true intraday series.
- BTC only. See the cross-symbol liquidity comparison for BTC vs. BNB vs. DOGE.
Full code and reproducible output: this public Jupyter notebook. Historical order book and trade data across all six venues is available through the API docs.
FAQ
What fraction of Kalshi's BTC strike ladder actually trades?
12.2% of all 827,654 usable hourly markets, across the full local history.
Does more trading volume mean a tighter spread on Kalshi's BTC markets?
Yes — a -0.32 correlation between log-volume and spread across all 100,760 traded markets. The data doesn't establish which one causes the other.
Are near-the-money BTC contracts more liquid than far ones on Kalshi?
Not established. A full-census row-level check fixed the dead-quote problem (73% of "near the money" rows are dead default quotes) but found a second, unidentified artifact in the next bucket, stable across 665,000+ rows.
When does BTC trading actually happen on Kalshi?
20:00-21:00 UTC is the peak; 06:00-10:00 UTC is nearly dead. Consistent with a US-hours-driven audience.
Is this based on a sample or the full dataset?
The full dataset: all 932,485 locally downloaded Kalshi BTC market files.
Why wasn't there a direct Kalshi-vs-Predict.fun price comparison?
The two venues' locally downloaded BTC histories don't overlap in time.