
Kalshi's hourly BTC markets run many simultaneous strike contracts at once. In a liquid options chain, you can back out the market's full implied probability distribution for where the underlying will land — the same read traders get from an options chain's shape. We tried it on a real Kalshi hour, and the result is a useful lesson about what "many listed strikes" doesn't guarantee.
Method
We picked KXBTC-26MAY1814 — an hourly BTC market on 2026-05-18 with 186 strikes spanning roughly $69,000 to $87,000, the highest-volume hour among a handful checked (~53,800 contracts total). For each strike, we read its price series and, at three points in the hour — start, midpoint, and 90% through — took each strike's most recent known value at or before that timestamp. Plotting value against strike approximates the market's implied probability distribution at that moment; where the curve crosses 0.5 approximates the implied median price.
The result: spiky, not smooth — and that's the actual finding
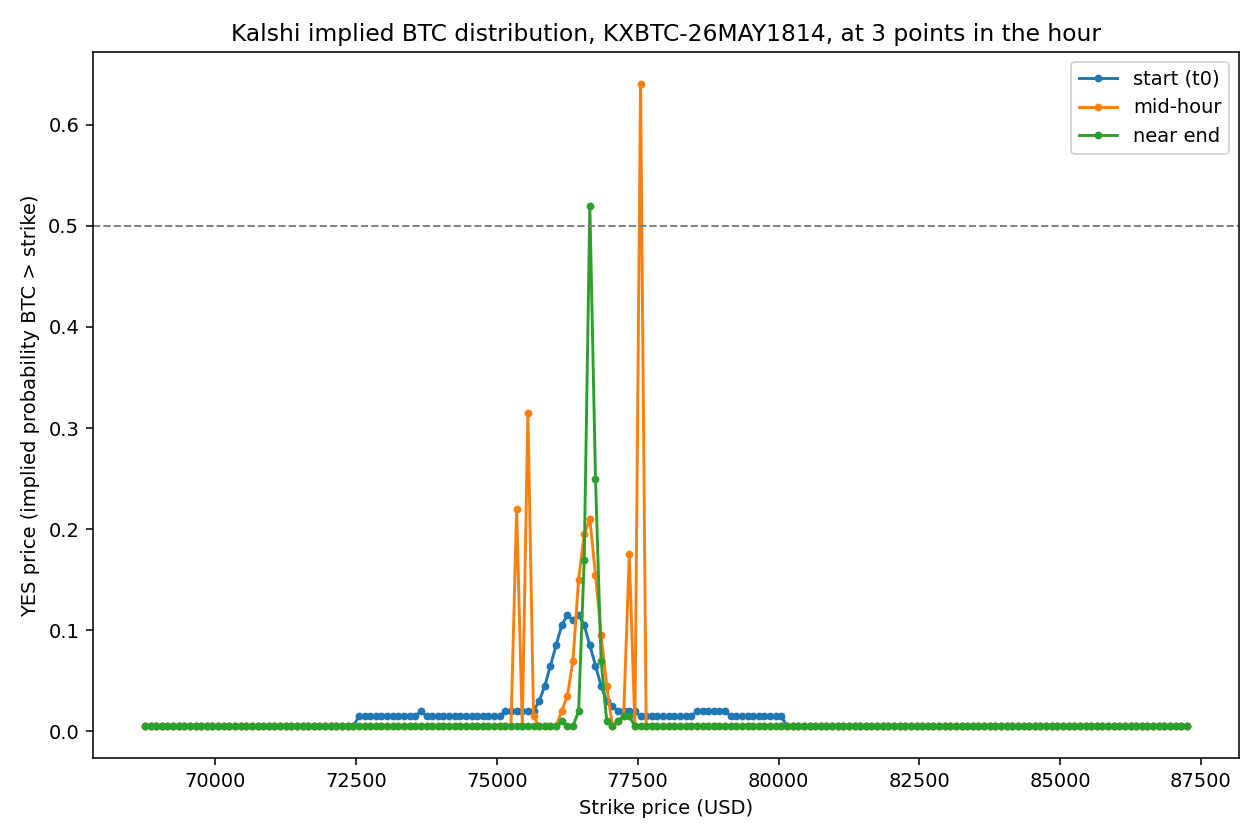
A liquid options chain produces a roughly monotonic, S-shaped curve — high probability at low strikes, smoothly falling to near-zero at high strikes. This isn't that. It's spiky and non-monotonic, with isolated jumps instead of a smooth roll-off.
That's directly explained by our earlier liquidity finding: only about 12% of Kalshi BTC strikes ever see a trade. Most points on this curve aren't live, continuously-updated prices — they're the last stale quote for a strike that hasn't traded in a while, sitting wherever it happened to get left. What we reconstructed is really a mix of a handful of genuinely live, actively-quoted strikes clustered near the market's real implied price, and a much larger number of stale, inactive ones contributing noise around them.
Despite the noise, the signal is still extractable
The implied median crossing point moves sensibly across the hour: $77,500 at mid-hour, drifting to $76,600 near the end — a real, plausible roughly $900 move over about 30 minutes. The start-of-hour crossing couldn't be determined at all; too many strikes' earliest available quotes weren't informative enough to locate where the curve actually crosses 0.5.
Deeper analysis: exactly how much of the curve is real, and what does filtering it reveal?
The section above attributed the spiky curve to stale quotes without measuring how much of it was actually stale, or attempting the liquidity-weighting flagged as the obvious next step. Both are done here.
How much of the curve is a default floor value, not a real quote? Looking at the raw distribution of values across all 186 strikes at the mid-hour checkpoint: 91.4% sit at exactly 0.005 — the exchange's minimum-tick floor, not a real quote reflecting any actual probability assessment. This isn't "noise around a real distribution." It's a tiny genuine signal (fewer than 9% of strikes) surrounded by an overwhelming majority that never had real price discovery during this hour at all.
What does the curve look like with only genuinely live strikes? Filtering to strikes with a quote no more than 10 minutes stale and a trade within the surrounding 30 minutes leaves just 13 of 186 strikes:
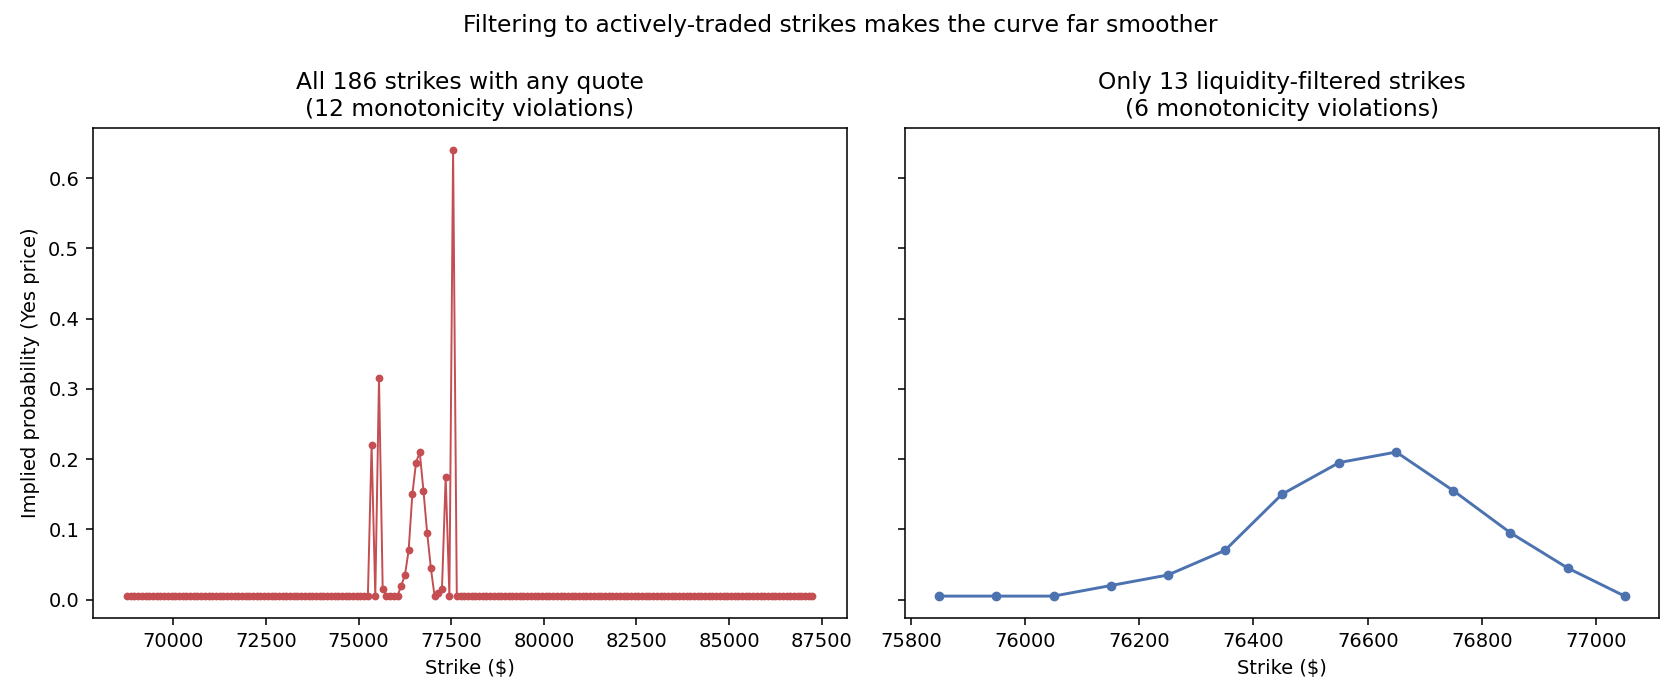
The filtered curve is a clean, single-peaked bump, not a monotonic S-curve — and that's actually the right shape. The 13 genuinely live strikes rise smoothly from 0.005 up to a peak of 0.21 at $76,650, then fall smoothly back down. That's a density-like shape — "which $100-wide bucket will BTC's price land in" — not a cumulative "probability BTC finishes above this strike" shape, which is what a monotonic S-curve would represent.
This is a real correction to the original framing: Kalshi's hourly BTC strikes (KXBTC-{date}{hour}-B{strike}) are better read as a probability density across narrow price buckets than as a cumulative distribution. A single peaked bump — not a smooth monotonic fall-off — is the shape to expect from a liquid version of this contract structure. The "0.5 crossing = implied median" method in the earlier section still produced a sensible number because one bucket happened to clear 50% in this particular hour, but that's a coincidence of this hour's concentration, not a generally reliable way to read a bucket-structured ladder — a peak-finding approach would be more robust for this contract type generally.
Practical implications
- Quantify staleness before trusting any multi-strike reconstruction. "91.4% of strikes sit at the minimum-tick floor" is a concrete, checkable number — far more useful than eyeballing a spiky chart and calling it noisy.
- For Kalshi's narrow-bucket strike ladders, look for the peak, not a 0.5 crossing. A single-bucket contract structure produces a density-shaped curve; a crossing-based median finder only works when one bucket happens to concentrate enough probability, which isn't guaranteed.
- A reusable liquidity filter (staleness + nearby trade) is cheap and worth applying by default to any future multi-strike reconstruction on this dataset — it turned an uninterpretable 186-point scatter into a clean 13-point curve with almost no extra code.
- This strengthens, not weakens, the original concentration finding. Our ticker liquidity research estimated roughly 12% of BTC strikes trade; this specific hour's 13-of-186 genuinely live count (7%) is consistent with that, now confirmed down to an individual hour rather than an aggregate estimate.
Methodology limits
- One hour, one day. A single case study, not a systematic sample — chosen for having the highest volume among a handful checked, which biases toward a better-than-typical example rather than a representative one.
- "Value at or before" can return a stale quote. For sparsely-traded strikes, the plotted value may be old relative to the checkpoint time, not a genuinely live price at that moment.
- Liquidity-weighting now attempted — the deeper analysis above filters to strikes with a fresh quote and a nearby trade, confirming the filtered curve is far cleaner, though it leaves very few points (13 of 186) to work with.
What this means
The reconstruction technique works well enough to extract a real, sensible implied median price and track how it drifts within an hour. But the underlying "distribution" is much noisier than a liquid options chain would produce, because most individual strikes in Kalshi's ladder simply aren't liquid. This is the concrete, visible consequence of the concentration already found in our ticker liquidity research: a strike ladder with 186 listed contracts doesn't mean a genuinely liquid distribution across all 186 of them — it means a small liquid core surrounded by a lot of stale noise.
Full code and reproducible output: this public Jupyter notebook. Historical order book and trade data across all six venues is available through the API docs.
FAQ
Can you reliably back out Kalshi's implied BTC distribution from its strike ladder?
Partially — the implied median (where the curve crosses 0.5) is extractable and moves sensibly, but the full distribution shape is too noisy to trust the way an options-chain-derived distribution normally would be.
Why is the curve so spiky instead of smooth?
Because most strikes in the ladder rarely trade — in this hour, 91.4% of strikes sit at the exchange's minimum-tick floor, not a real quote. A spiky curve mixes a tiny number of genuinely live, actively-quoted strikes with an overwhelming majority of never-priced ones.
What does the curve look like with only the real data?
A clean, single-peaked bump — not a monotonic S-curve. That's consistent with Kalshi's narrow strike buckets behaving like a probability density (which $100 band will the price land in) rather than a cumulative "above this strike" distribution.
Is this a one-off finding, or does it generalize?
Not established — this is a single hour on a single day, chosen for having relatively high volume. A systematic version across many hours is a natural next step.
Does this affect how much you should trust a single Kalshi strike's price as a probability estimate?
Yes, cautiously — if a specific strike hasn't traded recently, its displayed price may be stale rather than a live, currently-accurate probability.