

Our weather-resolution research found that Kalshi and Polymarket settle weather contracts off different sources. This piece asks a narrower question using only Polymarket's own data: does calibration vary by city?
Method
Polymarket's weather files use two filename conventions — will-the-highest-temperature-in-{city}-be-... and highest-temperature-in-{city}-on-{date}-... — and every file matching either one is included: a full census, not a sample. For each resolved market, we forward-filled the Yes price, took the last value as the outcome (0 if ≤0.02, 1 if ≥0.98, dropped otherwise), and computed Brier score at five points through the market's observed lifetime — 10%, 25%, 50%, 75%, 90% — matching the category-level Brier study's methodology. Cities need at least 30 total files to be included.
Eight cities clear that bar: London and New York by a wide margin (2,403 and 2,378 files), and Atlanta, Dallas, Seattle, Buenos Aires, Seoul, and Toronto in a tighter band of 210-224 each. Denver, Phoenix, Miami, Chicago, Los Angeles, and Dubai all stay under 30 files and are excluded.
Results
| City | Resolved markets | Total files | Brier score |
|---|---|---|---|
| Atlanta | 210 | 210 | 0.080 |
| Dallas | 224 | 224 | 0.085 |
| Toronto | 210 | 210 | 0.089 |
| Seattle | 217 | 217 | 0.092 |
| London | 2,388 | 2,403 | 0.097 |
| Buenos Aires | 210 | 210 | 0.101 |
| New York | 2,354 | 2,378 | 0.105 |
| Seoul | 210 | 210 | 0.116 |
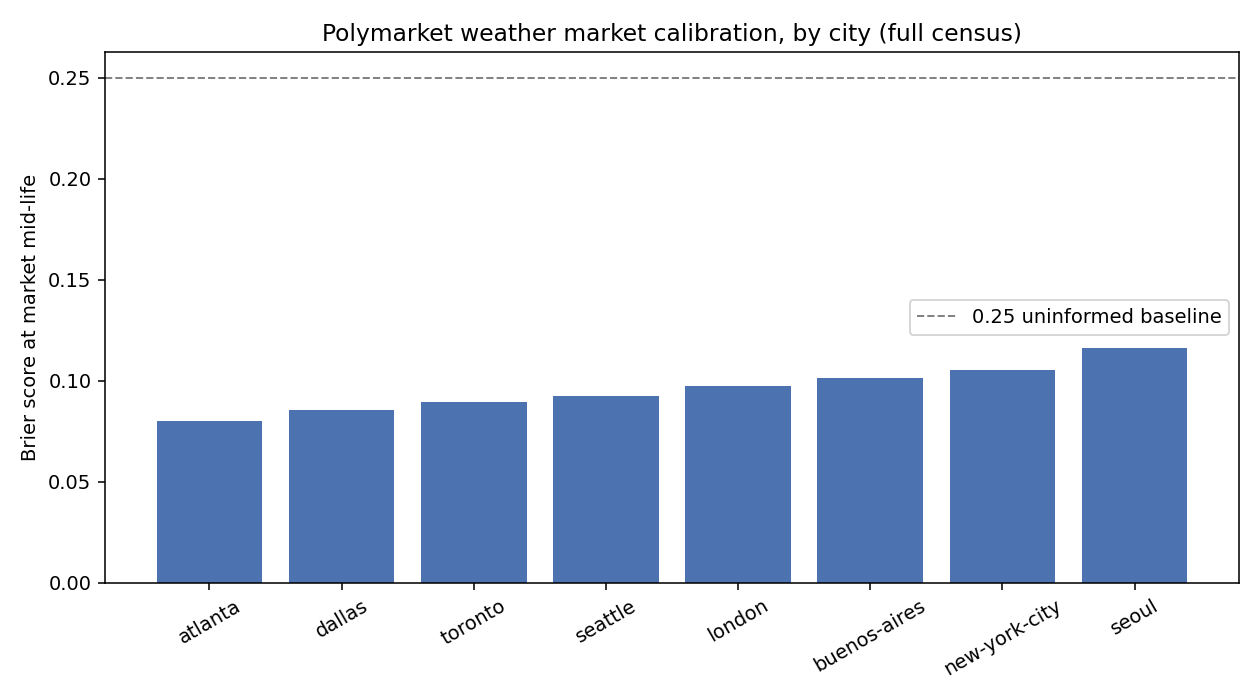
Atlanta calibrates best (0.080); Seoul worst (0.116). London and New York — the two cities with by far the deepest sample, over 2,300 resolved markets each — sit in the middle of the pack, not at either extreme. Every city beats the 0.25 uninformed baseline by a wide margin, but which city has the most data doesn't predict where it lands in the ranking.
Does sample size predict calibration?
London and New York have roughly ten times more resolved markets than any other city here, and calibrate in the middle of the pack rather than at the top. That's worth checking directly: is there any relationship between how much data a city has and how well it calibrates?
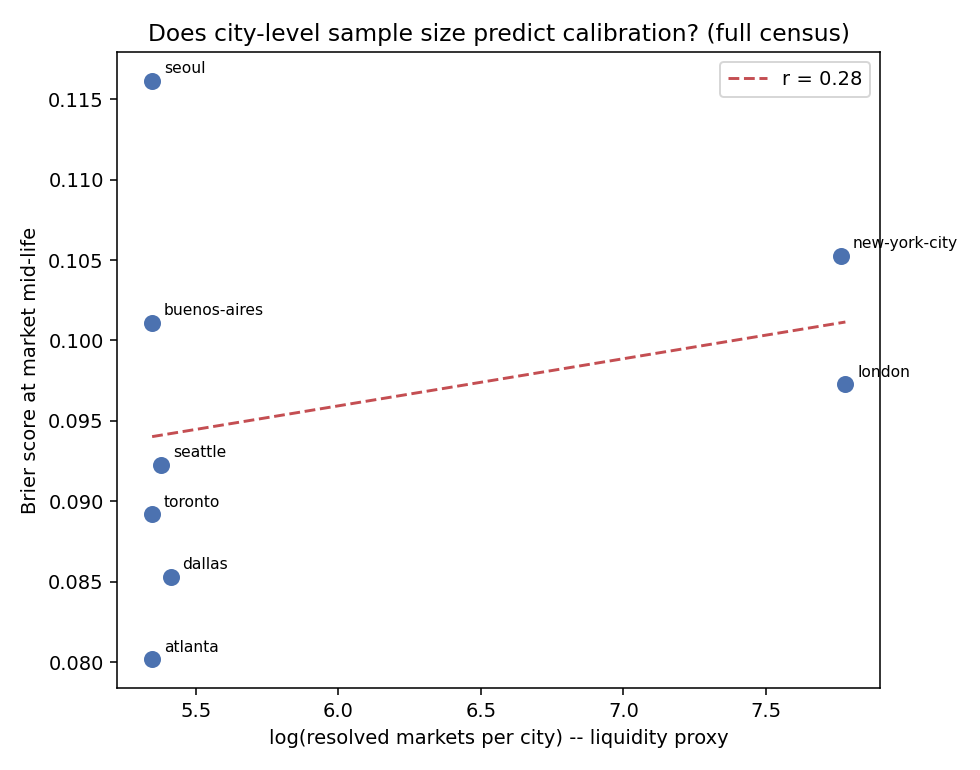
No. r = 0.28, t = 0.72 on 6 degrees of freedom — not significant, and in the direction opposite a "more data, better calibration" story if anything. London and New York calibrate worse than four of the six smaller cities despite an order of magnitude more data each. Sample size doesn't predict calibration here, in either direction.
Does calibration sharpen the same way across cities?
A single mid-life number can't show when a city's calibration improves — whether prices start rough and sharpen near resolution, or stay noisy the whole way through. The category-level Brier study found that distinction matters more than the midpoint score alone. Same check here, by city.
| City | 10% | 25% | 50% | 75% | 90% |
|---|---|---|---|---|---|
| Atlanta | 0.114 | 0.105 | 0.080 | 0.056 | 0.021 |
| Dallas | 0.116 | 0.101 | 0.085 | 0.067 | 0.030 |
| Toronto | 0.138 | 0.122 | 0.089 | 0.068 | 0.043 |
| Seattle | 0.125 | 0.123 | 0.092 | 0.068 | 0.032 |
| London | 0.120 | 0.110 | 0.097 | 0.076 | 0.028 |
| Buenos Aires | 0.145 | 0.117 | 0.101 | 0.073 | 0.020 |
| New York | 0.128 | 0.116 | 0.105 | 0.083 | 0.032 |
| Seoul | 0.146 | 0.134 | 0.116 | 0.065 | 0.018 |
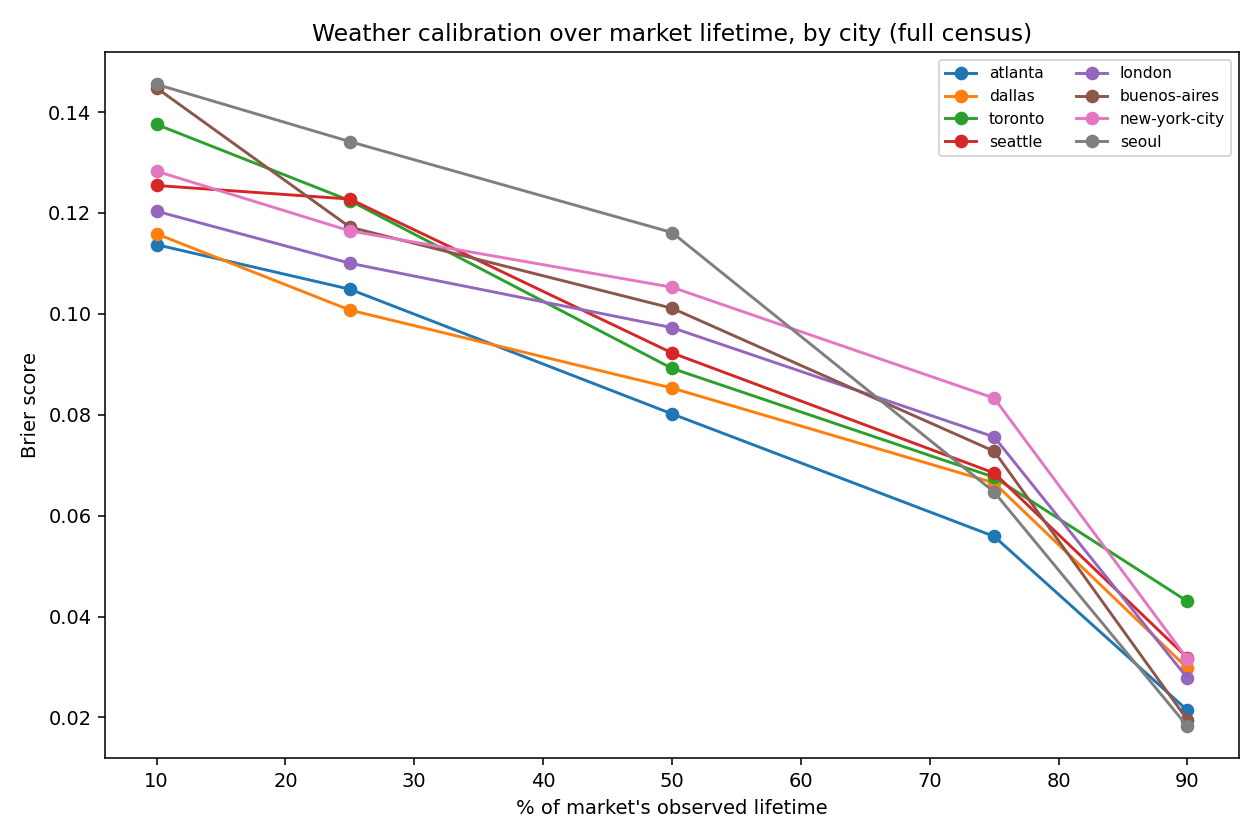
Every city sharpens toward resolution, and the ranking mostly holds across checkpoints. All eight cities improve substantially from the 10% to the 90% checkpoint — weather markets behave like crypto and news in the category study, not like sports. Atlanta and Dallas lead at every checkpoint from 10% through 75%; Seoul and Buenos Aires start worst. By 90%, the gap narrows to a tight band (0.018-0.043) across all eight cities — late in a weather market's life, which city it covers barely matters, consistent with the forecast converging on a near-certain outcome for everyone close to the deadline, regardless of city.
Methodology limits
- Resolution-outcome inference, not the on-chain record — the 0.02/0.98 cutoff is a proxy, consistent with the rest of this research series.
- Cities below 30 total files excluded: Denver (15), Phoenix (14), Miami (14), Chicago (14), Los Angeles (14), Dubai (7).
- 119 files are a different kind of market, not a missed city. A scan confirms they're hurricanes, earthquakes, monthly temperature records, and per-city "white Christmas" yes/no markets (Miami, Chicago, Boston, and others) — a different market structure (one binary outcome, not a temperature-bucket ladder) that this per-bucket methodology doesn't cover.
Practical implications
- Don't apply a liquidity-based confidence adjustment to Polymarket weather prices by city. London and New York calibrate in the middle of the pack despite far more data than any other city — more history doesn't buy sharper pricing here.
- Early-life weather prices vary more by city than late-life ones. At the 10% checkpoint the gap between best (Atlanta, 0.114) and worst (Seoul, 0.146) is real; by 90% it's mostly gone. Which city you're pricing matters more early in a market's life than close to resolution.
- Check a category's filename conventions against its full directory listing before computing per-entity sample sizes. Mixed naming conventions are common in scraped market data, and a regex that only catches one of them will quietly undercount whatever entities happen to use the other.
- For anyone extending this to more cities: the six smaller cities here (210-224 resolved markets each) already give the correlation test real statistical power at n=8 cities. Adding Denver, Phoenix, Miami, Chicago, Los Angeles, or Dubai would need substantially more locally downloaded history first — each currently sits at 7-15 total files, well under the 30-file minimum.
Full code and reproducible output: this public Jupyter notebook. Historical weather-category data across Kalshi and Polymarket is available through the API docs.
FAQ
Which Polymarket weather market is best-calibrated?
Atlanta, with a Brier score of 0.080 at market mid-life, computed from a full census of 210 resolved markets.
Does more trading activity mean better calibration, by city?
No. The correlation between log sample size and Brier score is r = 0.28 (not significant) — London and New York, the two cities with the most data by a wide margin, calibrate worse than four of the six smaller cities.
Is the city-level calibration gap as large as the category-level gap?
No — roughly 0.08 to 0.12 across cities here, versus roughly 0.05 to 0.19 across categories in the category study. City matters less than category.
Does calibration improve as a weather market approaches resolution?
Yes, for every city checked, and by a similar amount — at the 90% checkpoint, all eight cities converge to a tight 0.018-0.043 band regardless of their mid-life ranking.
Why are some cities excluded?
Denver, Phoenix, Miami, Chicago, Los Angeles, and Dubai each have fewer than 30 total locally downloaded files — not enough to compute a reliable Brier score.