

Most market-making backtests are single-venue by necessity — getting clean L2 order-book history for even one exchange is enough of a project. We wanted to see what happens when you remove that constraint: run the exact same strategy, unmodified, against four structurally different BTCUSDT perpetuals venues on the same day, using one data pipeline for all of them.
We used the Avellaneda-Stoikov (2008) optimal market-making model — a well-known reference strategy — on November 4, 2026, across Binance, OKX, Hyperliquid, and Deribit. Full code, full outputs, and all four charts below are in the public notebook if you want to check the work or run a different parameter set yourself.
The honest headline: the strategy lost money on all four venues. That's not a flaw in the test — November 4 was a trending session, the specific regime a symmetric market-maker is worst-positioned for. The actual point of this piece isn't "does AS make money" — it's what pulling the same strategy across four venues through one schema actually looks like, and what the venue-by-venue differences reveal once you can compare them directly.
Methodology
Data pipeline. Order-book data came through the Convex Lake SDK's download_orderbook_deltas() call, which does three things in sequence: pulls raw compressed S3 orderbook snapshots, converts them to a vectorized pandas DataFrame with an int64 fixed-point schema, then converts that into NautilusTrader OrderBookDelta objects — the Cython-backed format NautilusTrader's backtest engine consumes directly. One SDK call per venue produced backtest-ready data with no separate real-time feed integration per exchange.
Why filter before converting to Cython objects, not after. The notebook makes a specific engineering point worth repeating: iterating tens of millions of OrderBookDelta objects to filter by timestamp is slow; filtering the same rows on the DataFrame first with a vectorized between() call is near-instant. For Binance specifically, this cut 33.9 million total deltas down to the 5.6 million actually inside the backtest window — a 468 MB pickle instead of a 2.6 GB one.
Date and window. 2026-11-04, 10:00–14:00 UTC — the European session close into the US pre-market.
Venues tested, and why two were skipped. Binance, OKX, Hyperliquid, and Deribit were backtested. Bybit was excluded because only options data was available for that date; Bitfinex was excluded because its orderbook data required a higher plan tier than the one used. Both exclusions are stated directly in the notebook rather than silently dropped.
Data actually pulled, per venue:
| Venue | Slug used | Compressed size | Deltas loaded (full day) | Deltas in 4h window |
|---|---|---|---|---|
| Binance | BTCPERP-book | 42.8 MB | 33.9M (full day) | 5,639,468 |
| OKX | BTCPERP-bbo | 10.5 MB | — | 273,525 |
| Deribit | BTCPERP-bbo | 6.2 MB | — | 127,446 |
| Hyperliquid | BTCPERP-bbo | 0.6 MB | — | 8,004 |
One data-quality note the notebook flags explicitly: for Binance, the -book file (periodic depth snapshots) is 42.8 MB — about 8× smaller than the -bbo file (338 MB, every individual best-bid/offer quote tick). That's counter-intuitive if you'd expect a full depth file to always be the larger one; it depends on how often each side of the book actually updates.
Fee schedules and tick sizes used per venue:
| Venue | Maker fee | Taker fee |
|---|---|---|
| Binance | 0.02% | 0.04% |
| OKX | 0.02% | 0.05% |
| Hyperliquid | 0.01% | 0.03% |
| Deribit | 0.00% | 0.03% |
The strategy. Avellaneda-Stoikov quotes symmetrically around a reservation price that skews away from current inventory:
r = s − q·γ·σ²·(T−t)
with an optimal half-spread of:
δ/2 = ½ · [γ·σ²·(T−t) + (2/γ)·ln(1 + γ/κ)]
where γ is risk aversion (inventory penalty), κ is the assumed market-impact/order-arrival rate, σ is rolling realized volatility, and T−t is time remaining in the quoting horizon. Orders only get re-submitted when the new quote moves by more than requote_threshold × δ, to avoid pointless churn on every book update.
Default parameters used for the main run: γ=0.1, κ=1.5, σ computed over a 100-tick rolling window, T=3600s (1-hour quoting horizon), order size 0.001 BTC per quote, max inventory 0.05 BTC, requote threshold 0.3×spread.
Backtest setup. One isolated NautilusTrader BacktestEngine per venue, each starting from a $100,000 USDT margin account, so results are directly comparable across venues without any cross-contamination.
Results
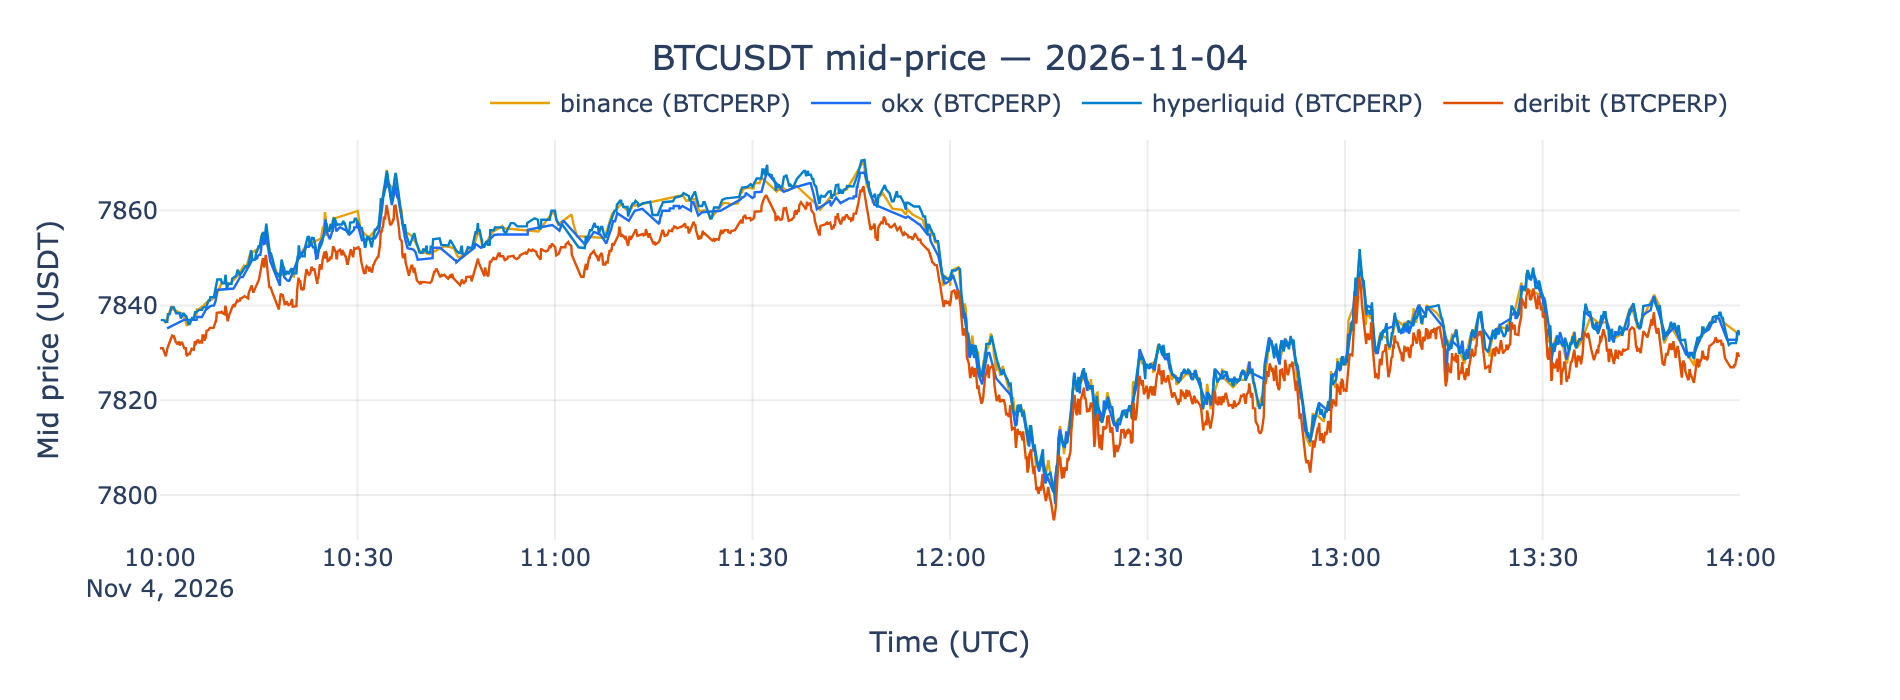
All four venues tracked the same underlying BTCUSDT move over the window — the data is internally consistent, which is the first sanity check before trusting anything downstream.
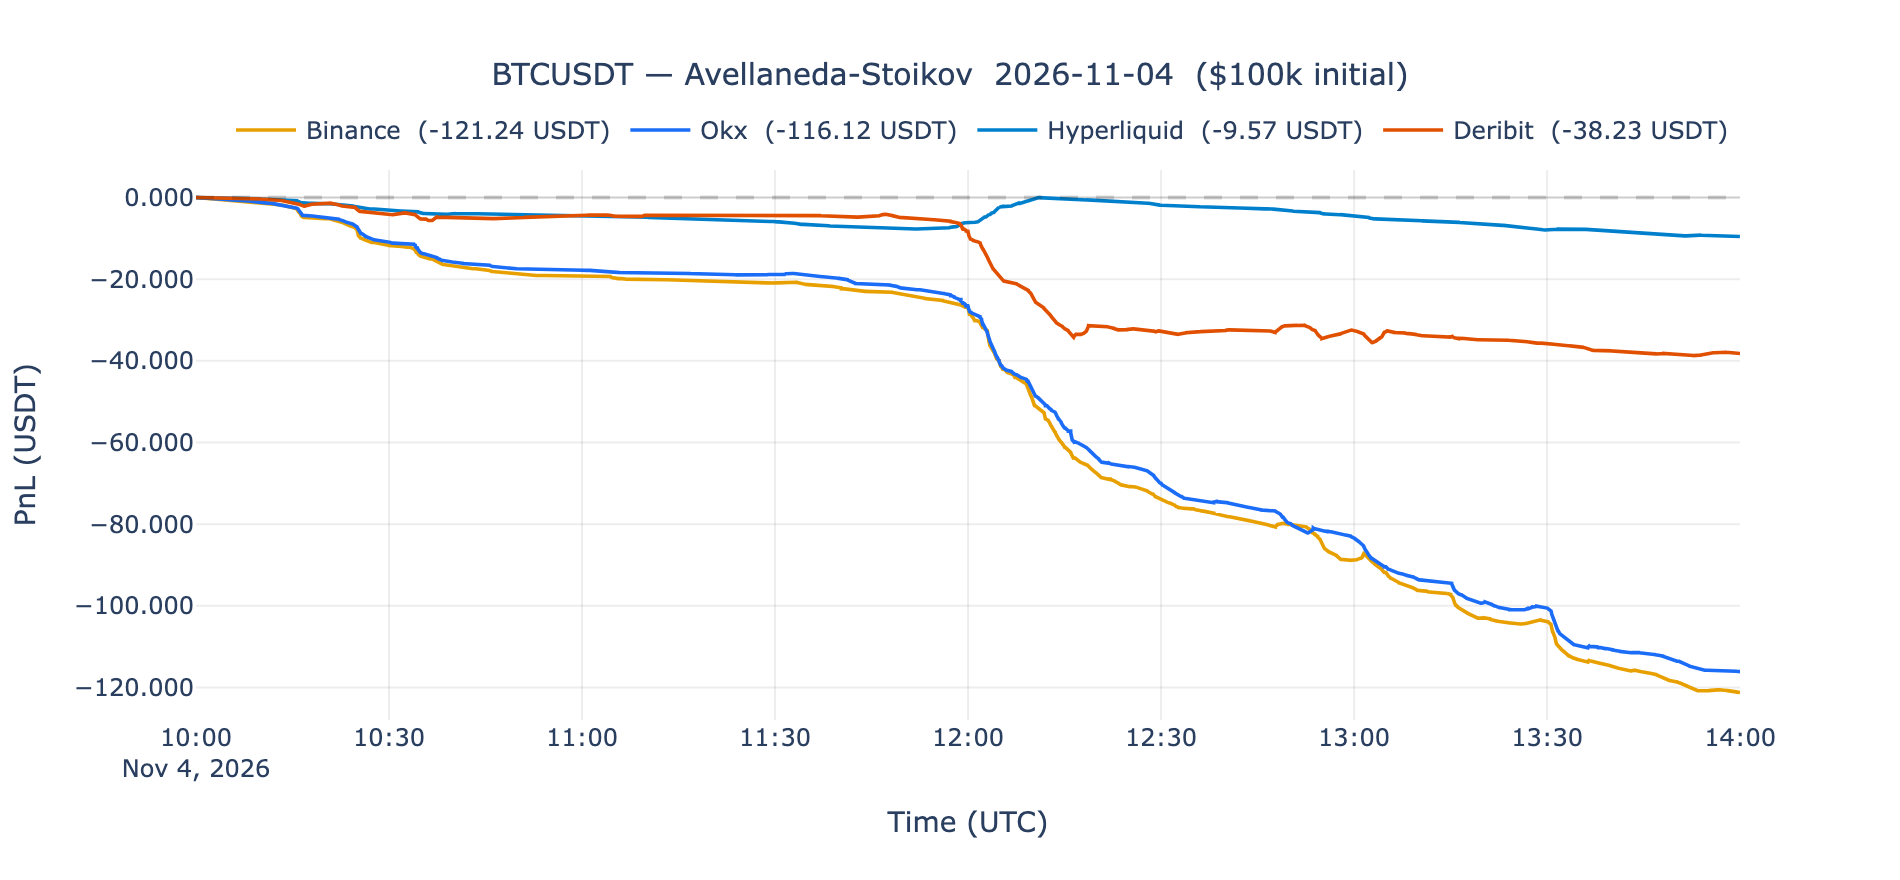
| Venue | Final PnL | Worst PnL | Peak PnL | Account events |
|---|---|---|---|---|
| Hyperliquid | −9.57 USDT | −9.57 USDT | 0.00 USDT | 5,828 |
| Deribit | −38.23 USDT | −38.82 USDT | 0.00 USDT | 33,823 |
| OKX | −116.12 USDT | −116.12 USDT | 0.00 USDT | 31,249 |
| Binance | −121.24 USDT | −121.24 USDT | 0.00 USDT | 150,697 |
Every venue finished negative. None ever crossed back to breakeven after the strategy started trading (peak PnL is 0.00 on all four — the starting point). The ranking tracks activity: Hyperliquid, with the thinnest order-book update rate of the four (8,004 deltas in the window) and the fewest account events (5,828), took the smallest loss. Binance, with by far the most book activity (5.6M deltas, 150,697 account events), accumulated the most adverse selection — more fills meant more exposure to the trending move working against inventory before it could be unwound.
Why every venue lost money
The notebook's own explanation, and it's a standard property of the model, not a bug in this run: Avellaneda-Stoikov is built on a mean-reverting price assumption. November 4 was a trending session — a sustained directional move. That's the specific regime where a symmetric market-maker gets hurt worst: inventory fills on one side as the price keeps moving away from it, and the loss crystallizes before the other side ever fills to offset it.
This isn't a reason to distrust the result — it's exactly the failure mode the original 2008 paper's own assumptions predict, showing up on real data.
Parameter sensitivity: which lever actually matters
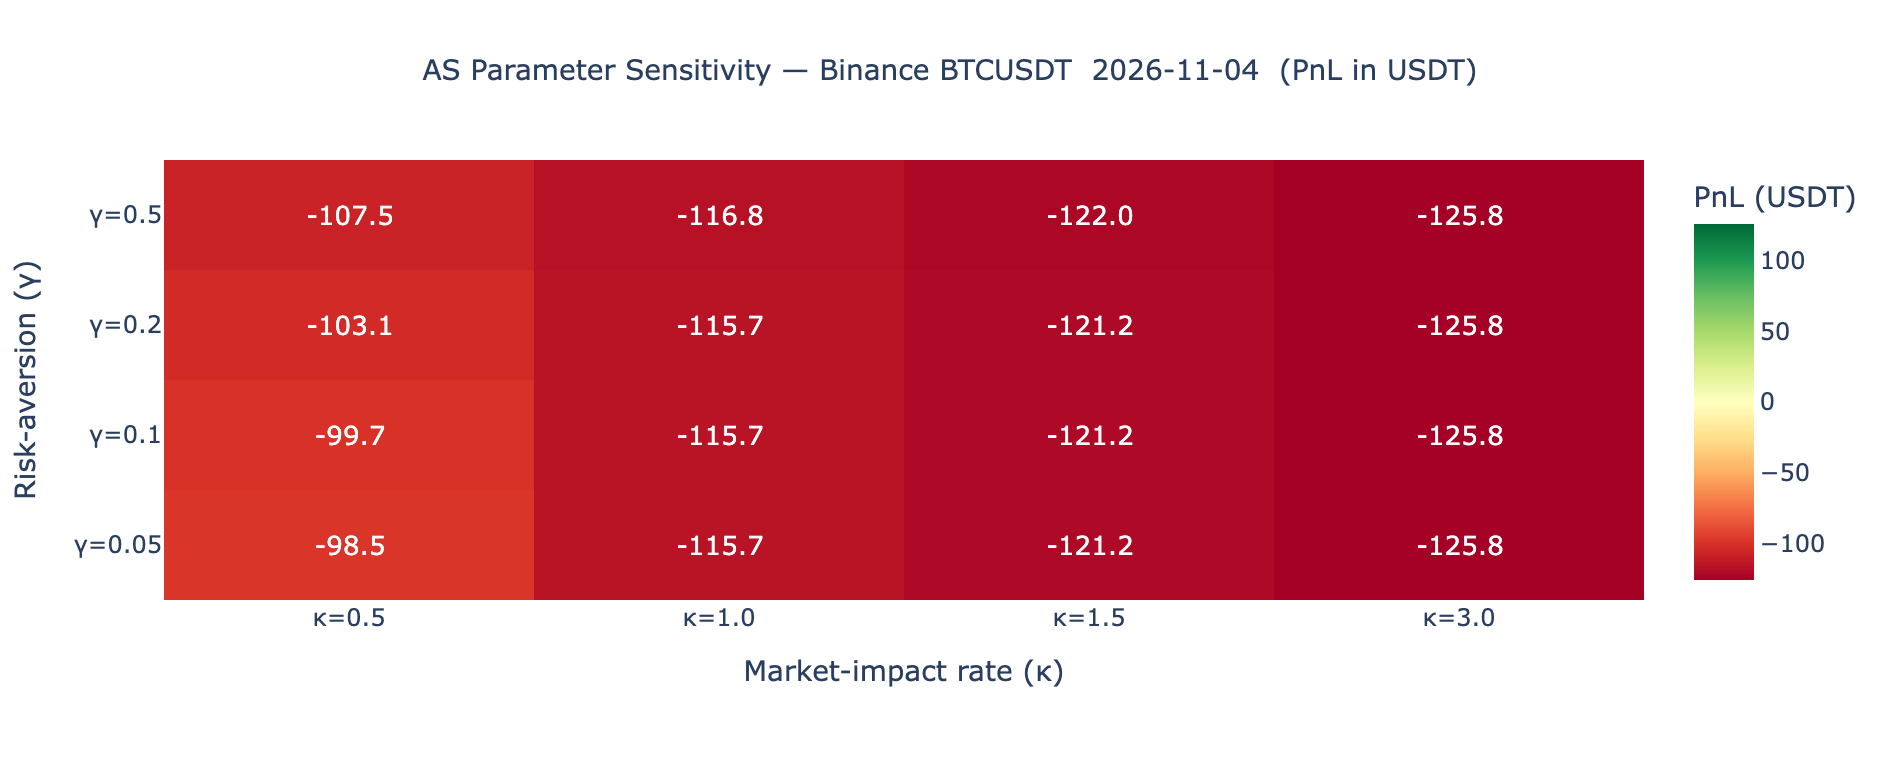
A grid search over γ ∈ {0.05, 0.1, 0.2, 0.5} and κ ∈ {0.5, 1.0, 1.5, 3.0}, run on Binance (the highest-activity venue, making it the most sensitive test case):
| γ \ κ | 0.5 | 1.0 | 1.5 | 3.0 |
|---|---|---|---|---|
| 0.05 | −98.52 | −115.69 | −121.23 | −125.83 |
| 0.10 | −99.72 | −115.69 | −121.24 | −125.83 |
| 0.20 | −103.06 | −115.67 | −121.24 | −125.83 |
| 0.50 | −107.45 | −116.85 | −122.00 | −125.83 |
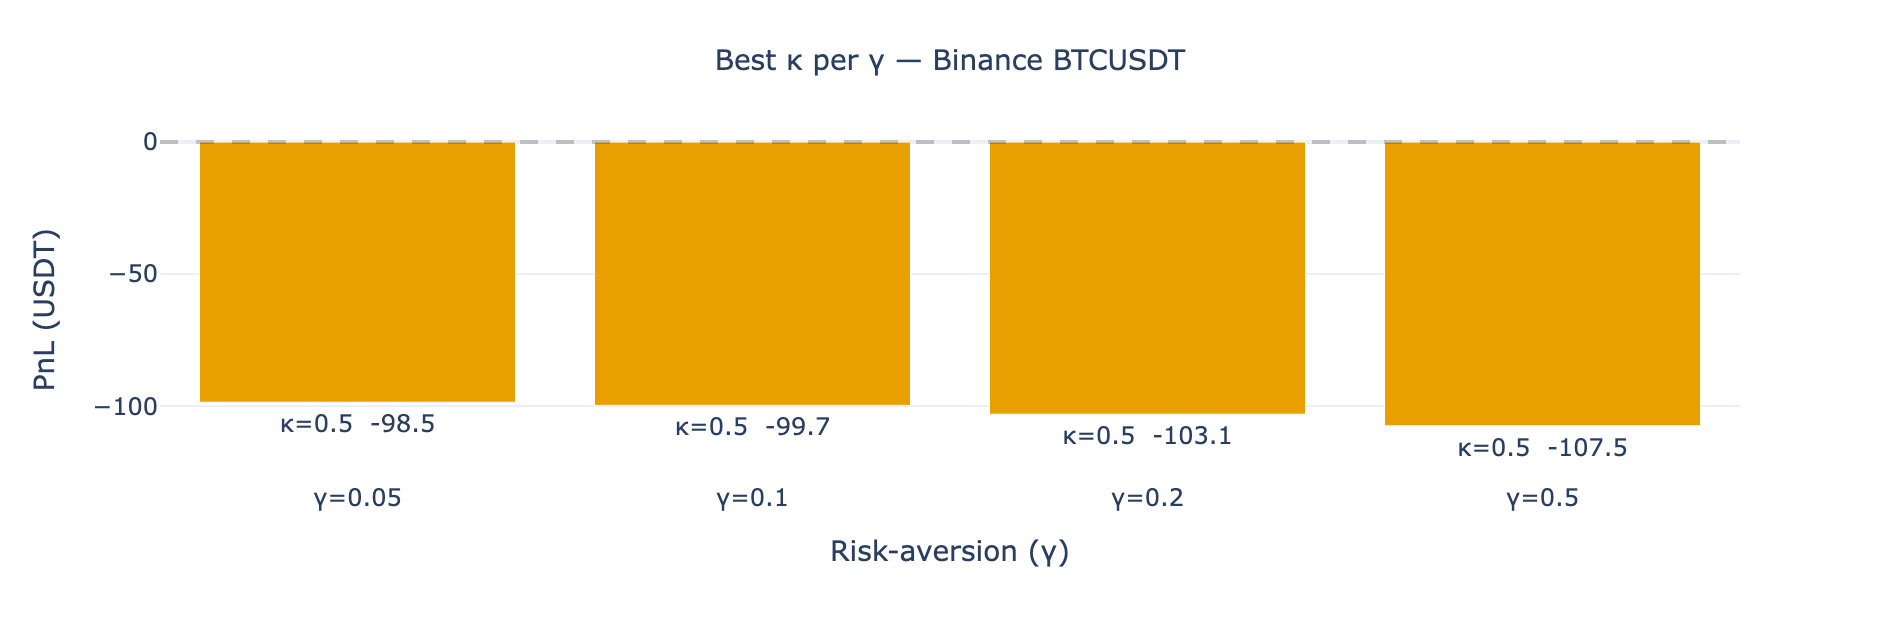
The pattern is unambiguous: κ is the dominant lever, γ barely matters. Reading across any row, PnL swings by roughly 27 USDT between κ=0.5 and κ=3.0. Reading down any column, PnL barely moves at all as γ changes. A low κ assumes the order book replenishes quickly, which justifies quoting a tighter spread — more fills, each carrying less directional risk before it can be offset. A high κ assumes slow replenishment, justifying a wider spread — fewer fills, but each one exposed to more adverse drift.
That γ (the inventory-risk-aversion term) had negligible effect here is itself informative: it suggests that on this particular trending day, spread width was the binding constraint on performance, not inventory skew. The best combination tested, γ=0.05/κ=0.5, reduced the loss to −98.52 USDT — about 19% better than the −121.24 USDT default — but no parameter combination in the grid reached breakeven.
What this actually demonstrates
The strategy result is secondary to the infrastructure result. Running identical strategy code against Binance, OKX, Hyperliquid, and Deribit required:
- One
download_orderbook_deltas()call per venue, same signature, same output type - Zero per-venue data-wrangling beyond fee schedule and tick-size configuration (venue-specific but trivial)
- No separate real-time or historical feed integration per exchange
That's the actual capability being shown: L2 order-book history across a centralized exchange (Binance, OKX, Deribit) and a fully on-chain venue (Hyperliquid) in one schema, converting directly into a format a standard open-source backtest engine (NautilusTrader) consumes without a translation layer. Whether this specific γ/κ pair is profitable on this specific day is a much smaller question than whether you can even ask it across four venues at once in the first place — most setups can't.
Methodology limits
- One day, one 4-hour window, one regime. This is a single trending session. A range-bound day — the regime Avellaneda-Stoikov is actually built for — would be expected to behave very differently, and that's a real next step, not a caveat that invalidates this run.
- Grid search run on one venue. The γ/κ sensitivity sweep used Binance only, as the highest-activity venue. Whether the same "κ dominates, γ doesn't" pattern holds on Hyperliquid or Deribit's much thinner books is untested here.
- Two venues excluded for data-availability reasons, not performance reasons. Bybit (options-only data that date) and Bitfinex (plan-tier restriction) aren't in the comparison — their absence says nothing about expected performance there.
- This is a worked example, not a production strategy. The notebook's own disclaimer is explicit about this: it's an implementation exercise based on the original Avellaneda-Stoikov paper, not investment advice or a trading system ready for live capital.
Check the work yourself
Every number, parameter, and chart above comes from this public Jupyter notebook — full code, the exact SDK calls, and reproducible outputs, not just a summary. L2 order-book history across Kalshi, Polymarket, Predict.fun, Limitless, Deribit, Binance, Hyperliquid, OKX, and Bitfinex, in one schema, is available through the API docs if you want to run this on a different day, a different parameter grid, or a different venue set entirely.
FAQ
Did the Avellaneda-Stoikov strategy make money in this backtest? No — it lost money on all four venues tested (Binance, OKX, Deribit, Hyperliquid), because November 4, 2026 was a trending session, which is the specific market regime a symmetric mean-reversion market-maker performs worst in.
Which parameter matters more: γ (risk aversion) or κ (market-impact rate)? κ, by a wide margin, at least in this test. A grid search across both found PnL varied by about 27 USDT across the κ range tested, while γ changes shifted results by only a few USDT either way.
Which venue performed best in the test, and why? Hyperliquid had the smallest loss (−9.57 USDT), but with the caveat that it also had by far the lowest order-book activity of the four venues (8,004 deltas vs. Binance's 5.6 million) — fewer book updates meant fewer forced fills for the strategy to get caught out on.
What data and tools does this backtest actually use?
Convex Lake's L2 order-book data, pulled via its SDK's download_orderbook_deltas() call, converted into NautilusTrader OrderBookDelta objects and run through NautilusTrader's open-source BacktestEngine — one isolated backtest per venue, each starting from a $100,000 USDT account.
Can I reproduce this or run it with different parameters? Yes — the notebook is public, and the grid-search cell is written to be edited directly: change the γ/κ lists, the date, or the venue, and re-run.