
Copytrading services exist across crypto and sports betting: follow a profitable account, mirror its trades automatically. Whether that works for short-duration crypto Up/Down markets depends on something most copytrading pitches skip over — how much a trade's price moves between the leader acting and a follower's order actually landing. We tested it directly, with real accounts, real trades, real millisecond-resolution order book history, and a round-trip latency model grounded in each venue's actual settlement architecture.
Data and method
Real trade histories for every account we could verify as net-profitable (realized PnL computed directly from each account's own trades) whose taker trades land in a market we have full order-book coverage for.
- Predict.fun: 451 real taker trades, 1 account, 29 real BTC 5-minute Up/Down markets.
- Limitless: 1,794 real taker trades, 7 real, independently profitable accounts, across 316 real BTC/ETH/BNB hourly Up/Down markets. An 8th matched account was excluded: real realized cashflow of -$22,044 — a losing account.
Taker trades only — a maker's resting limit order fills whenever someone else crosses it; the maker didn't choose that moment, so a delay doesn't apply the way it does to an active market order. Outcome-index correction — each market's book file represents one specific outcome token, and a trade on the complementary outcome needs its price and side flipped before comparing against that book, verified against real trades before trusting the full run. Walking the book, not a price delta — for each real trade and each delay, a market order of the same size is filled by walking the real book's levels, the actual depth-based fill a copytrader's order would get.
Getting the latency model right
An earlier version of this analysis measured "detection latency" as the gap between a trade's timestamp and the next order-book snapshot our own collector happened to capture. That's wrong — it measures our collector's polling rate, not anything a real copytrading bot would face. Here's the corrected version, grounded in each venue's actual settlement architecture.
Predict.fun matches orders off-chain through its own CLOB matching engine, with only settlement and payout going on-chain afterward. A bot with WebSocket access to that off-chain match feed can see a fill and submit its own order near-instantly, bounded by network and software overhead rather than block time. A bot that can only observe on-chain settlement needs to add roughly one BNB Chain block — 0.45 seconds, the current block time since the Fermi hard fork — per leg.
Limitless matches orders on-chain on Base — each fill is itself a confirmed Base transaction. Base's standard block time is 2.0 seconds, but Base's Flashblocks feature streams 200ms soft preconfirmations within that window, live on mainnet. A bot willing to act on a preconfirmation (accepting a small reorg risk) faces roughly 0.2 seconds per leg; a bot that waits for full confirmation faces 2.0 seconds per leg.
A full round trip has two legs — seeing the leader's trade, then getting your own order confirmed:
| Venue | Optimistic (preconfirmation / off-chain feed) | Conservative (full on-chain confirmation) |
|---|---|---|
| Predict.fun | ~0.1-0.3s | ~0.9-1s |
| Limitless | ~0.4s | ~4.0s |
These are the delay points simulated below, alongside a broader round-number grid.
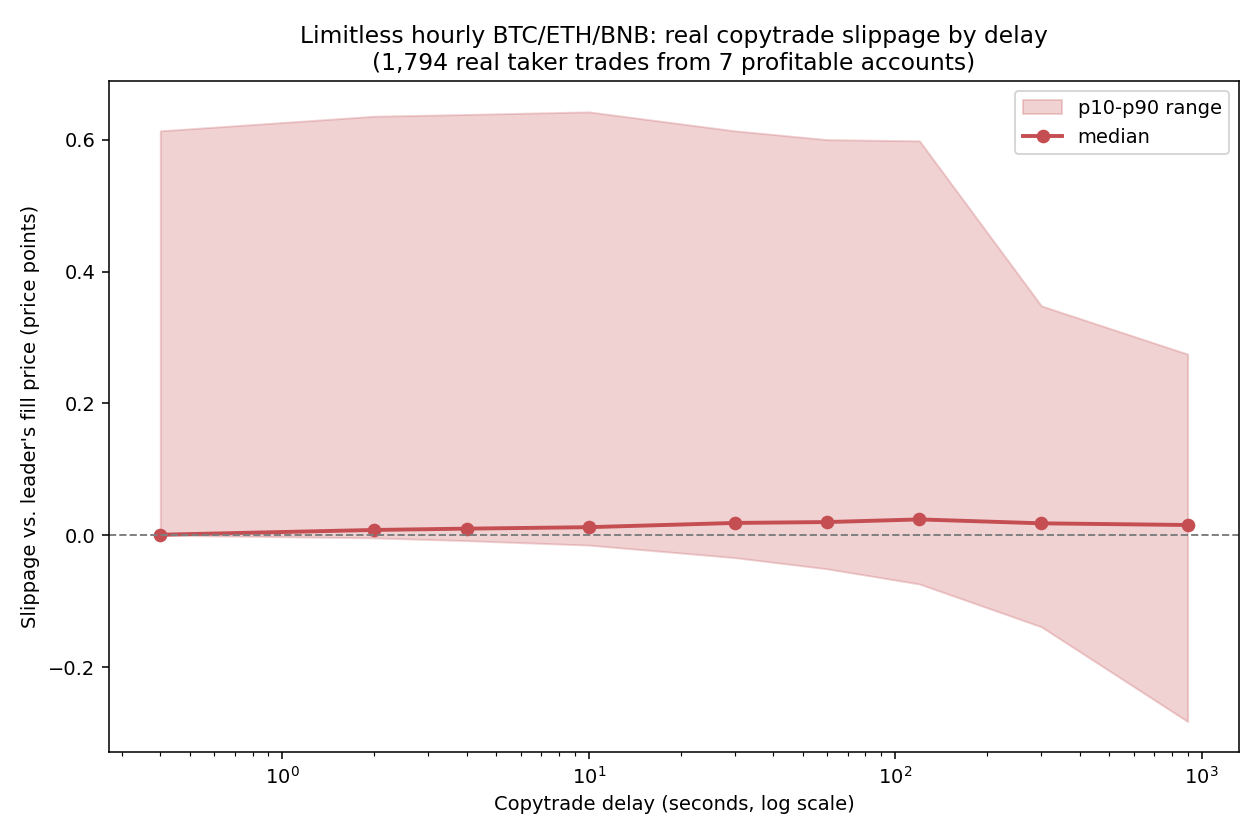
Finding 1: Limitless — small, statistically ironclad median slippage, with a real tail
| Delay | n | Median slippage | 95% CI | Sign-test z |
|---|---|---|---|---|
| 0.4s (optimistic) | 1,777 | +0.0007 | [+0.0000, +0.0022] | +23.8 *** |
| 2s | 1,773 | +0.0080 | [+0.0061, +0.0103] | +21.6 *** |
| 4s (conservative) | 1,772 | +0.0100 | [+0.0080, +0.0120] | +21.3 *** |
| 10s | 1,767 | +0.0122 | [+0.0100, +0.0170] | +19.8 *** |
| 60s | 1,552 | +0.0200 | [+0.0150, +0.0244] | +15.0 *** |
| 120s | 1,493 | +0.0240 | [+0.0187, +0.0307] | +12.7 *** |
At the optimistic 0.4-second round trip, median slippage is essentially zero (+0.0007) — but still statistically significant (z=+23.8) given 1,777 real trades. At the conservative 4-second round trip, median slippage is +0.01, one cent. Both are small in absolute terms. The p90, however, sits at 0.60+ at every delay from 2 seconds onward — unchanged whether the round trip is optimistic or conservative. Speed doesn't fix the tail, because the tail isn't a speed problem.
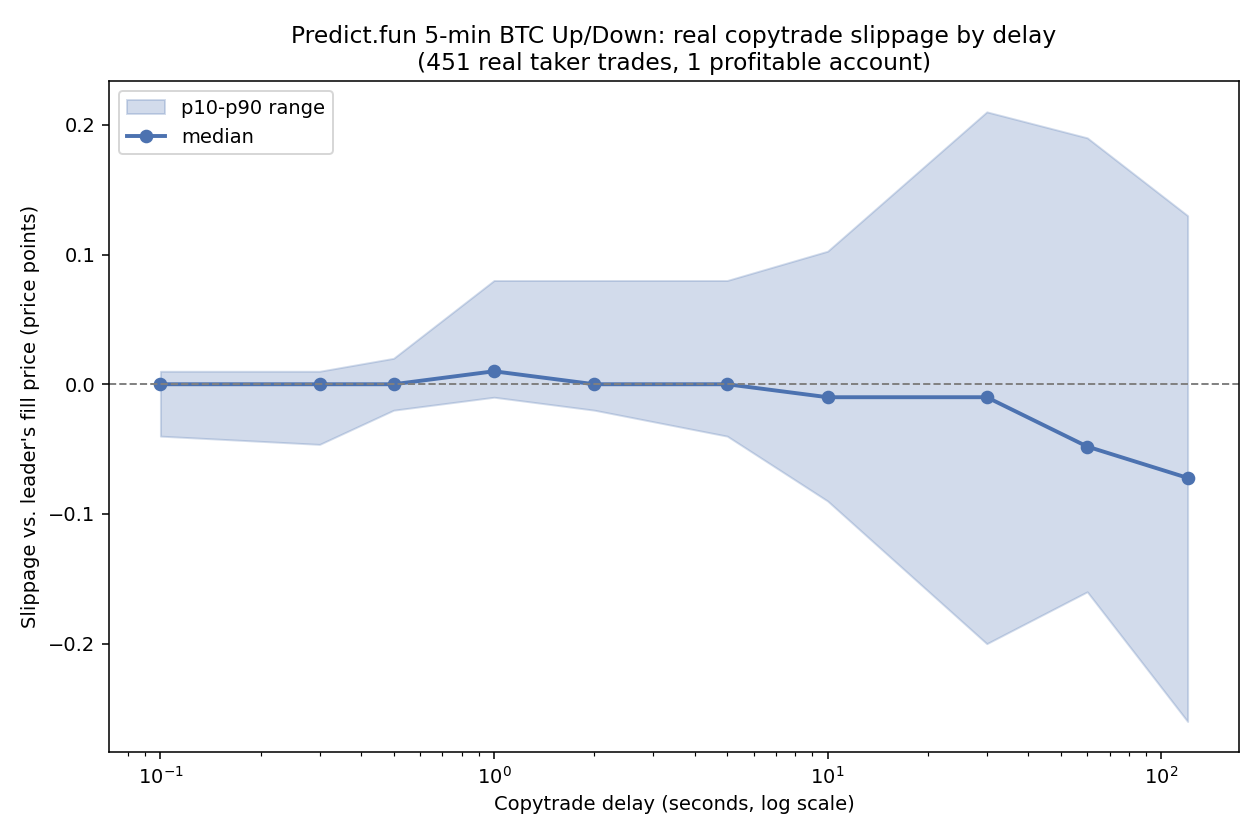
Finding 2: Predict.fun — a smaller sample, a more fragile signal
| Delay | n | Median slippage | 95% CI | Sign-test z |
|---|---|---|---|---|
| 0.1s (optimistic) | 451 | -0.0000 | [-0.0000, +0.0000] | -7.0 *** |
| 0.3s | 449 | -0.0000 | [-0.0000, +0.0000] | -6.5 *** |
| ~1s (conservative) | 448 | +0.0100 | [+0.0029, +0.0100] | +7.9 *** |
| 10s | 448 | -0.0100 | [-0.0100, -0.0090] | -3.1 *** |
| 60s | 381 | -0.0480 | [-0.0700, -0.0326] | -3.3 *** |
At the optimistic round trip, median slippage is exactly zero and the sign test actually points negative (z≈-7) — the off-chain match is fast enough that a copytrader's fill is, if anything, indistinguishable from or slightly better than the leader's. At the conservative round trip (~1s), the sign flips slightly positive. Neither is dramatic, and the direction genuinely flips again at longer, less realistic delays — reported honestly rather than forced into one story. With only 451 trades from a single account, treat this as a smaller, noisier picture than Limitless's.
When do these accounts actually trade?
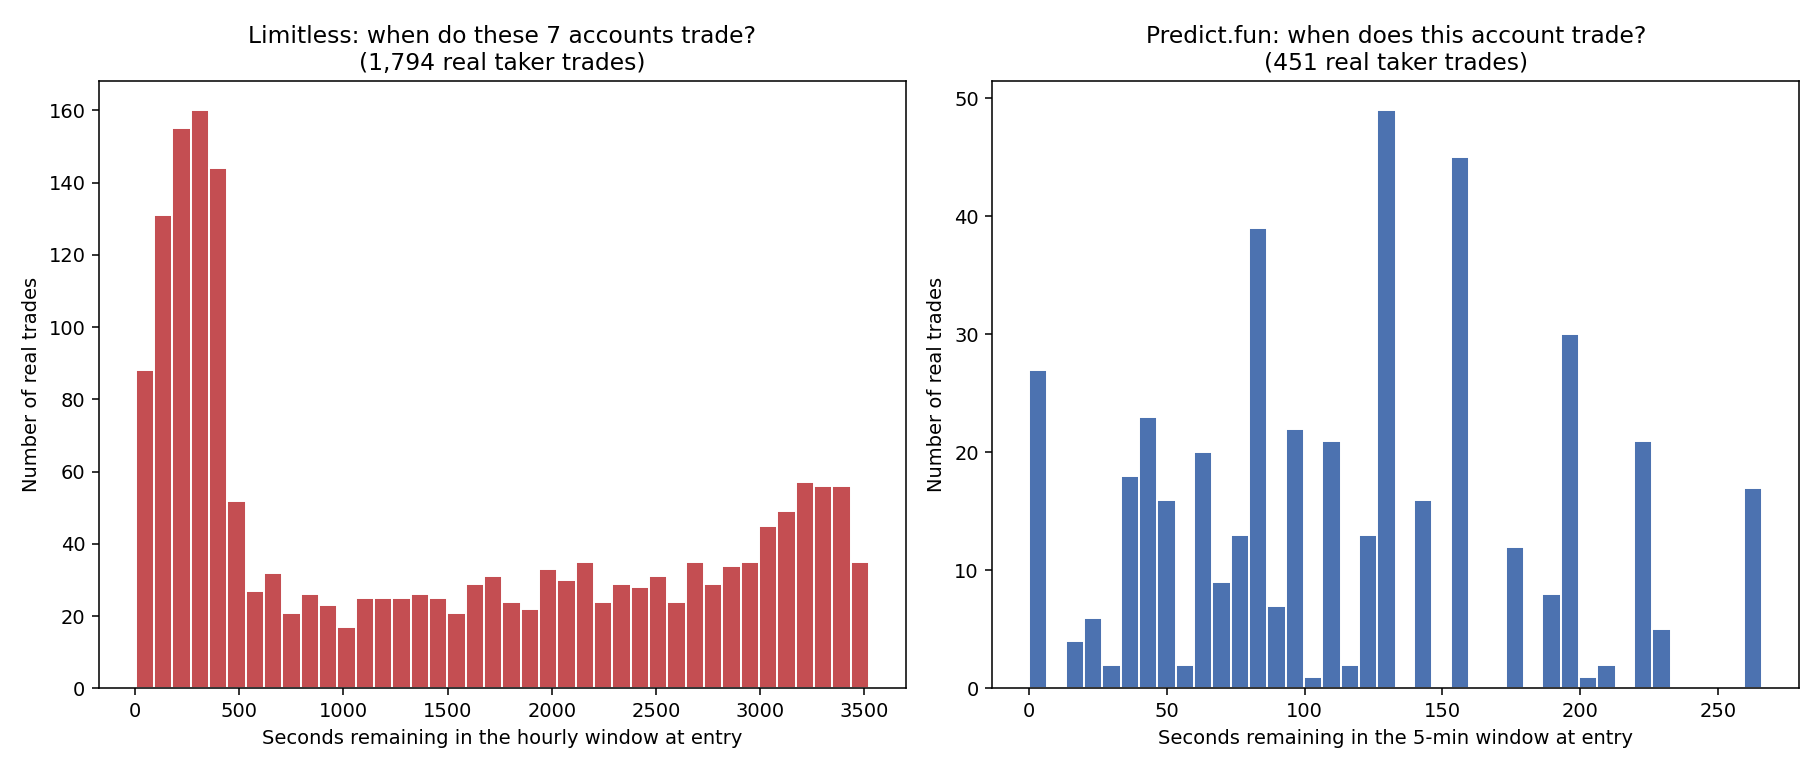
Both distributions skew toward the back half of their window rather than spreading evenly through it — consistent with the median remaining-time figures already established (269s of a 3,600s hour for Limitless; 111s of a 300s window for Predict.fun). This matters directly for the tail risk above: trades concentrated late in a window are trades placed exactly where near-touch liquidity is most likely to have already thinned out.
The full shape of the slippage distribution, not just percentile summaries
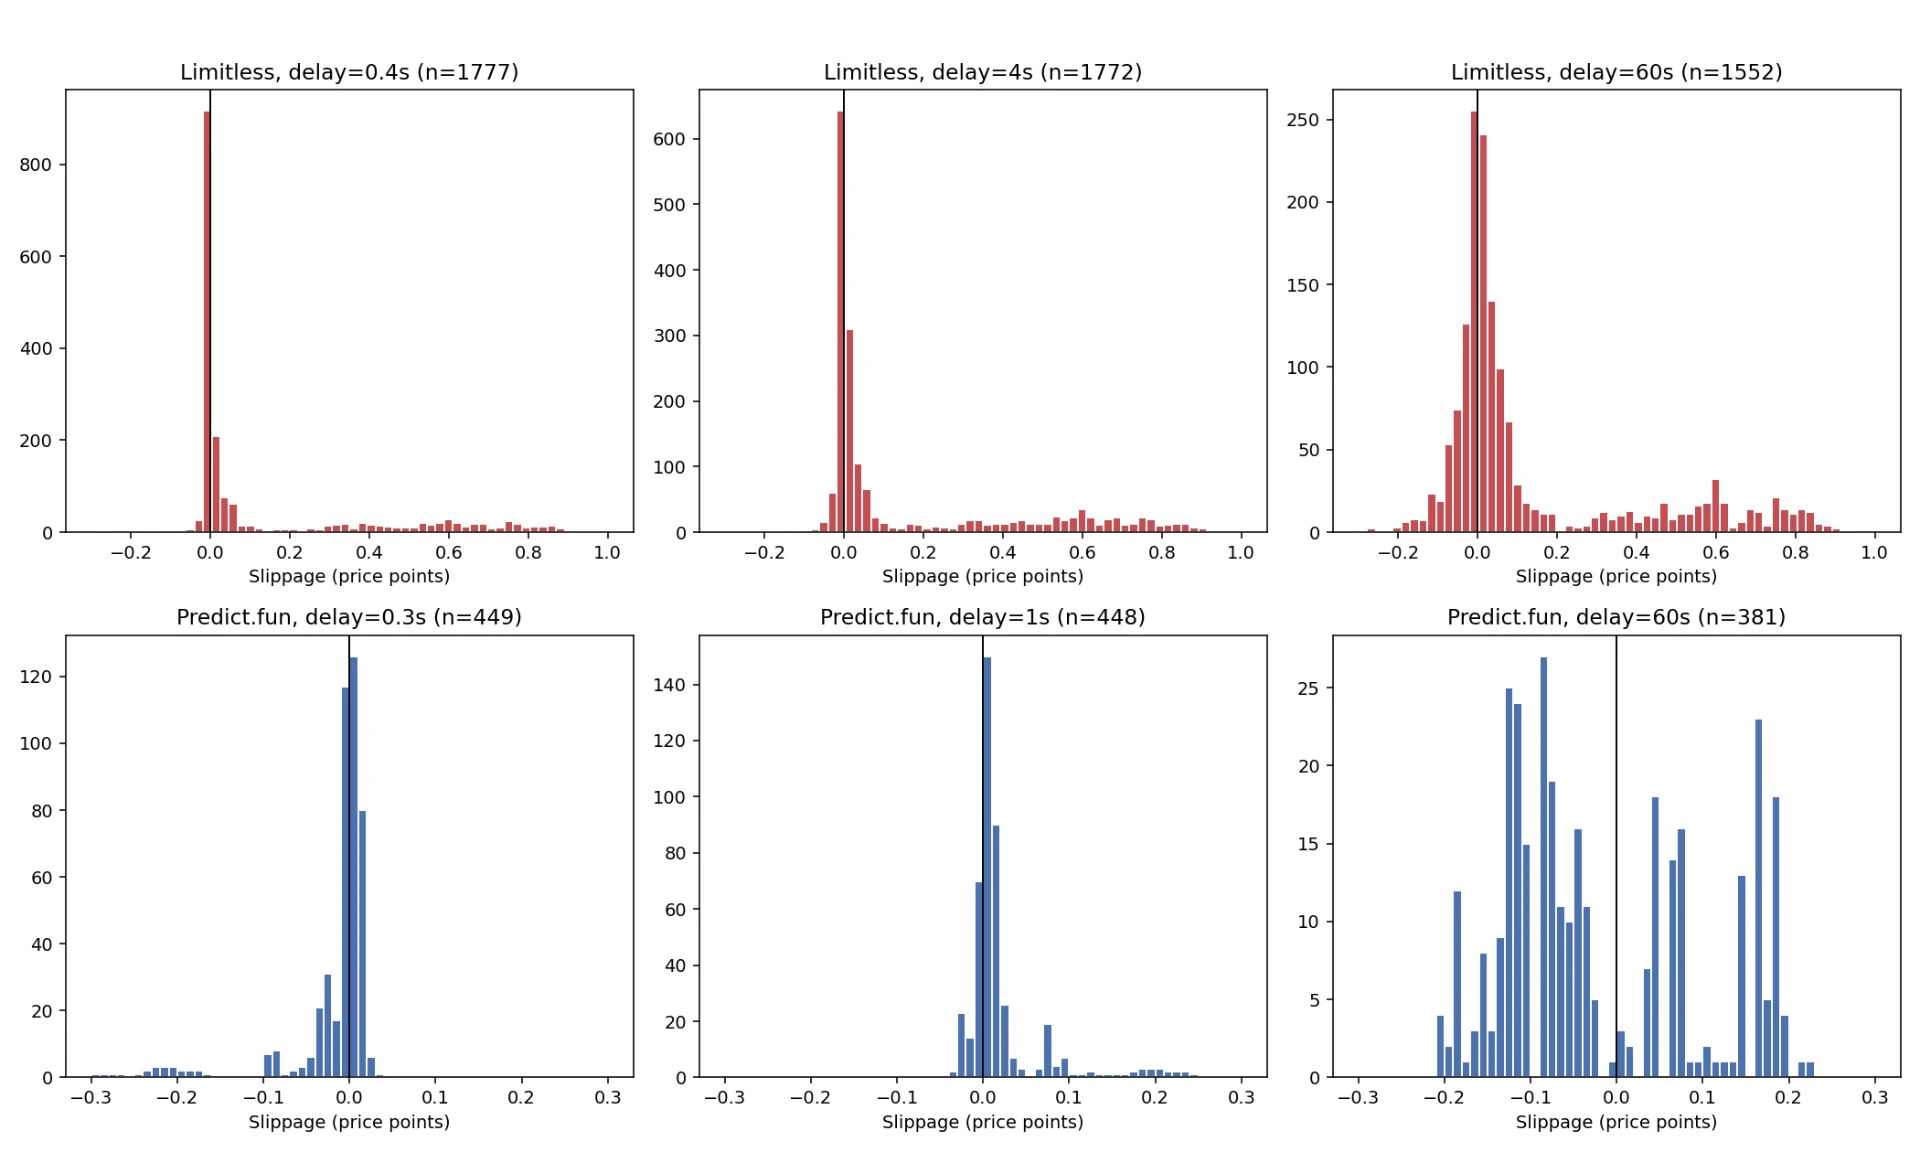
This is the real reason percentile bands alone understate what's happening. Limitless's distribution at every delay is a tight spike near zero plus a thin, separate cluster out past +0.6-0.9 — genuinely bimodal, not a single spread-out bell curve. A "median" and "mean" describe two different populations of trades that happen to share a label. Predict.fun's distribution stays single-peaked and much narrower at every delay shown — a real structural difference between the two venues' tail risk, visible directly in the shape, not just inferred from summary statistics.
A concrete example of the tail
One real trade: the leader bought 535 shares of ETH-Up at $0.02, about 60 seconds before the hour closed. A simulated copytrade of the same size landed at $0.995 just 10 seconds later, and stayed there through 2 minutes.
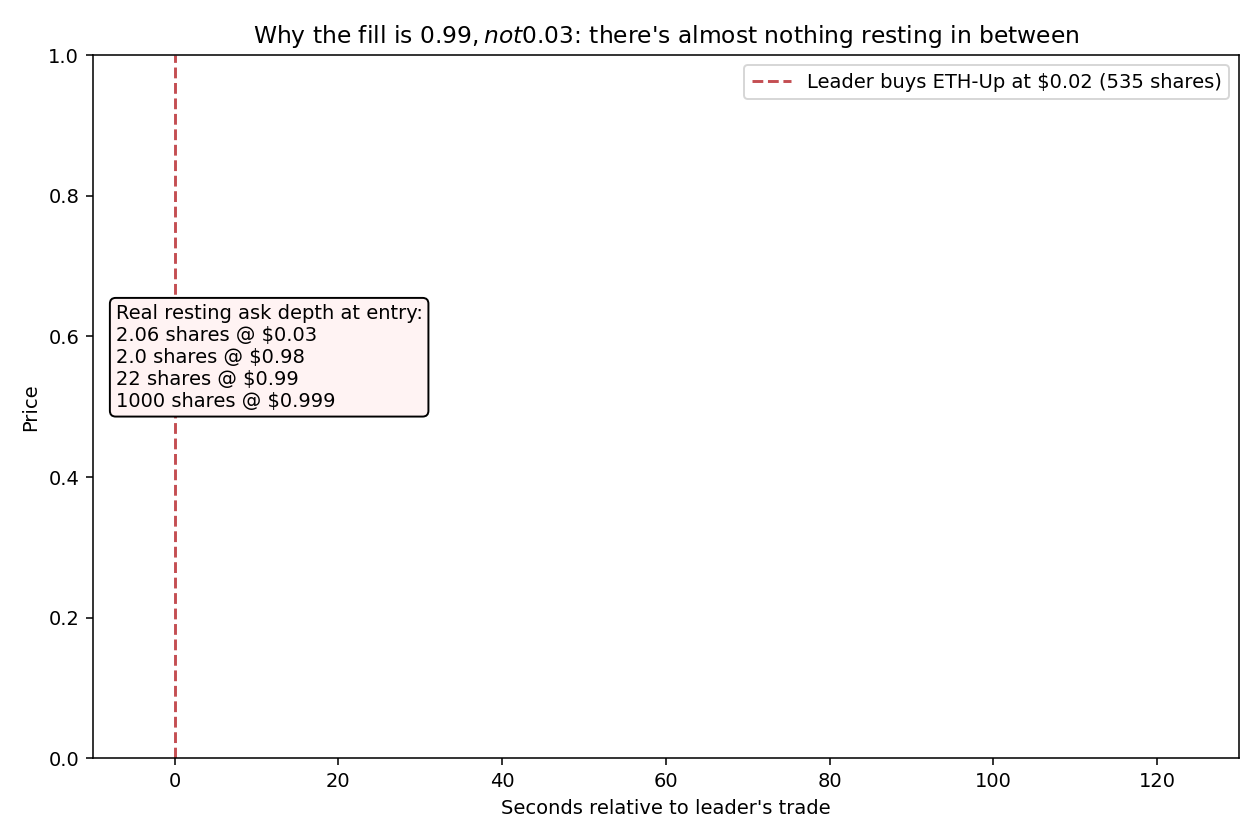
This is one real, verified case from the right-hand cluster in the distribution above — not the typical trade. The leader's own 535-share order filled at a clean $0.02 — real depth existed at the exact instant they traded. By the next available snapshot, near-touch depth had collapsed to a couple of shares, with the next real resting orders sitting all the way out at $0.98-$0.999.
What does this look like as an actual equity curve?
Everything above is in price points or percentiles. The real question is simpler: if you had actually been copytrading one of these accounts, with a realistic round-trip delay, would you have made money? We reconstructed real realized PnL — not a cost proxy — for one representative account per venue, and compared it against the same trades executed at the simulated copytrade price.
Predict.fun gives real per-trade outcomes directly: every taker trade carries a WON/LOST field for that specific position. Limitless doesn't carry that field, but this particular account's own trade history does something more useful: it consistently buys both outcomes of the same market within seconds of each other (one side cheap as the taker trade we simulate, the other as a resting maker order), then claims a real, recorded USDC payout once the market resolves — a dual-sided, thin-margin arbitrage, not a directional bet. The real Claim events give the actual dollar payout; the real cost of both legs gives the actual cost. Substituting the simulated copytrade price for only the taker leg isolates exactly what copytrading-latency costs within an otherwise identical, real position.
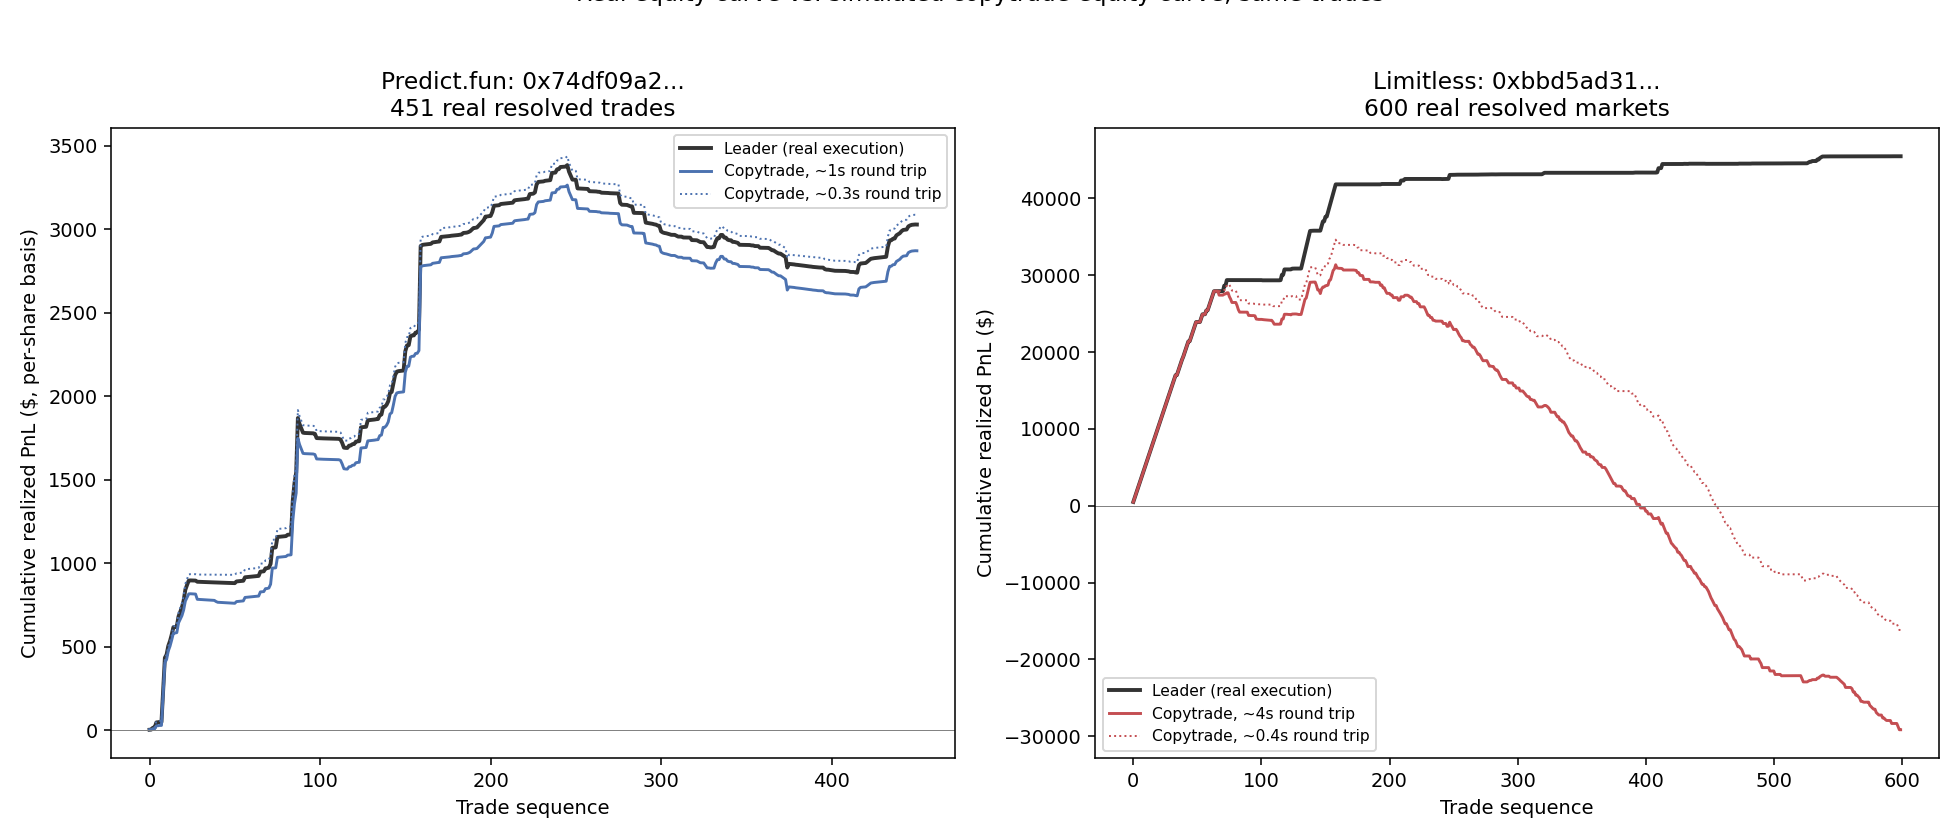
Predict.fun's directional strategy survives copytrading comfortably. The conservative-delay copytrade curve ($2,872) tracks about 5% below the leader's real $3,029 — a real cost, not a rounding error, but nowhere near enough to erase the edge. The optimistic-delay curve ($3,087) is actually slightly above the leader's own result.
Limitless's dual-sided arbitrage does not survive copytrading at all, at either delay. The leader's real equity curve closes at +$45,492 over 600 resolved markets. The identical trades, with only the taker leg replaced by a realistic copytrade fill, close at -$29,146 (conservative round trip) or -$16,163 (optimistic). Per-market, the median cost of copytrading is exactly $0 — consistent with the earlier finding that typical slippage is tiny — but 38% of the 600 markets cost more than $100 each, up to $586 on the worst one, and that tail alone is larger than the entire strategy's real profit. A strategy built on a thin, high-volume edge is exactly the kind of strategy where the tail risk established earlier stops being an abstract percentile and starts being the whole ballgame.
Practical implications
- The strategy type decides whether copytrading survives, more than speed does. A directional strategy (Predict.fun) loses a real but modest ~5% to copytrading at a conservative latency. A thin-margin, high-volume arbitrage strategy (Limitless) loses everything and goes substantially negative, at either a conservative or an optimistic latency — because its entire edge is smaller, per trade, than the tail risk a realistic copytrading delay exposes it to.
- At a realistic round-trip latency, median slippage is close to zero on both venues. Predict.fun's optimistic round trip (0.1-0.3s, off-chain match) shows a median statistically indistinguishable from — or slightly better than — the leader's own price. Limitless's optimistic round trip (0.4s, Flashblocks preconfirmation) shows median slippage of under a tenth of a cent. A real edge should survive this comfortably.
- The tail is the real cost, and it doesn't shrink with speed. Limitless's 90th percentile sits at 0.60+ regardless of whether the round trip is 0.4 seconds or 4 — the distribution is bimodal, not continuous, so there's no delay short enough to dodge the cluster of trades that hit a genuine liquidity collapse.
- Detection latency is architecture-dependent, not a single number. An off-chain-matched venue (Predict.fun) lets a well-built bot react in well under a second; an on-chain-matched venue (Limitless) has a real floor set by the chain's own block time, roughly 0.4-4 seconds on Base depending on whether you accept Flashblocks preconfirmation risk. Neither number should be assumed — both come from the venue's actual settlement design, checked here against current, dated figures (BNB Chain's Fermi hard fork, Base's Flashblocks).
- A naive "time between our own observations" is not a latency measurement. An earlier pass at this analysis made exactly that mistake, reporting a sub-second number that had nothing to do with how fast a real copytrading bot could actually act. Any latency claim in this kind of analysis needs to be tied to the venue's real matching and settlement architecture, not the convenience of whatever data happened to be collected.
- Check when an account trades relative to each market's own lifecycle before copytrading it. Every tail case in this study came from a trade placed in the back half of a window — exactly where the entry-timing histograms above show these profitable accounts concentrate their activity.
Full code and reproducible output: this public Jupyter notebook. Historical trade and order-book data across Kalshi, Polymarket, Predict.fun, Limitless, Deribit, and Binance options is available through the API docs.
FAQ
Can you copytrade a prediction-market account profitably?
It depends on the strategy, not just the latency. Reconstructing real equity curves from two real accounts: a directional strategy on Predict.fun lost about 5% to copytrading at a realistic delay and stayed profitable. A thin-margin arbitrage strategy on Limitless went from a real +$45,492 profit to a -$16,000 to -$29,000 loss on the identical trades, because its edge per trade was smaller than the tail risk a realistic delay exposes it to.
How is "latency" actually measured here?
Grounded in each venue's real settlement architecture, not assumed or measured off our own data collection. Predict.fun matches orders off-chain, so a bot with direct feed access reacts in well under a second. Limitless matches on-chain on Base, so each leg of a round trip needs either a 200ms Flashblocks preconfirmation (small reorg risk) or a full 2.0-second block confirmation.
Why did an earlier pass at this analysis use a different latency number?
It measured the gap between a trade and the next snapshot our own order-book collector happened to capture — a property of our data pipeline, not a real-world latency. This version replaces that with a latency floor derived from each chain's actual, currently verified block time and matching architecture.
What does the slippage distribution actually look like, not just the average?
On Limitless, genuinely bimodal: most trades cluster tightly near zero slippage, with a separate, smaller cluster out past 0.6-0.9. On Predict.fun, single-peaked and much narrower. The shape, not just the median, is why a percentile summary alone can understate the real risk.
Does this generalize to other venues or longer-duration markets?
Not established here — this is specifically about short-duration (5-minute and hourly) crypto Up/Down markets on two venues with different settlement architectures. Longer-duration or differently-structured markets would need their own version of this test.